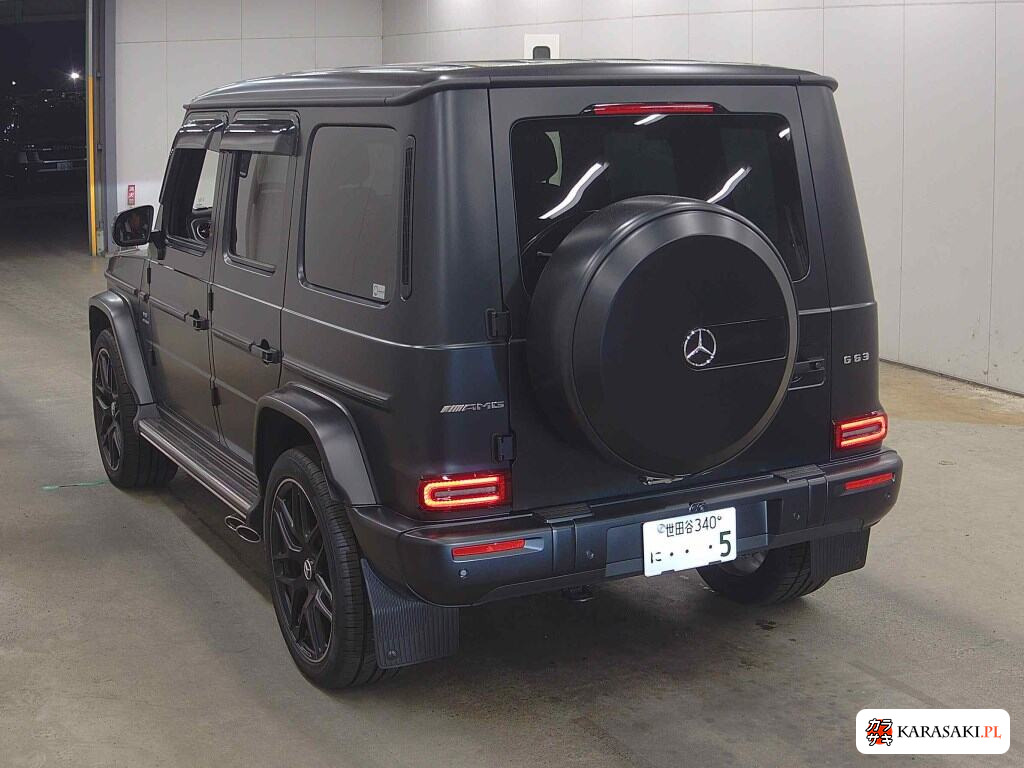
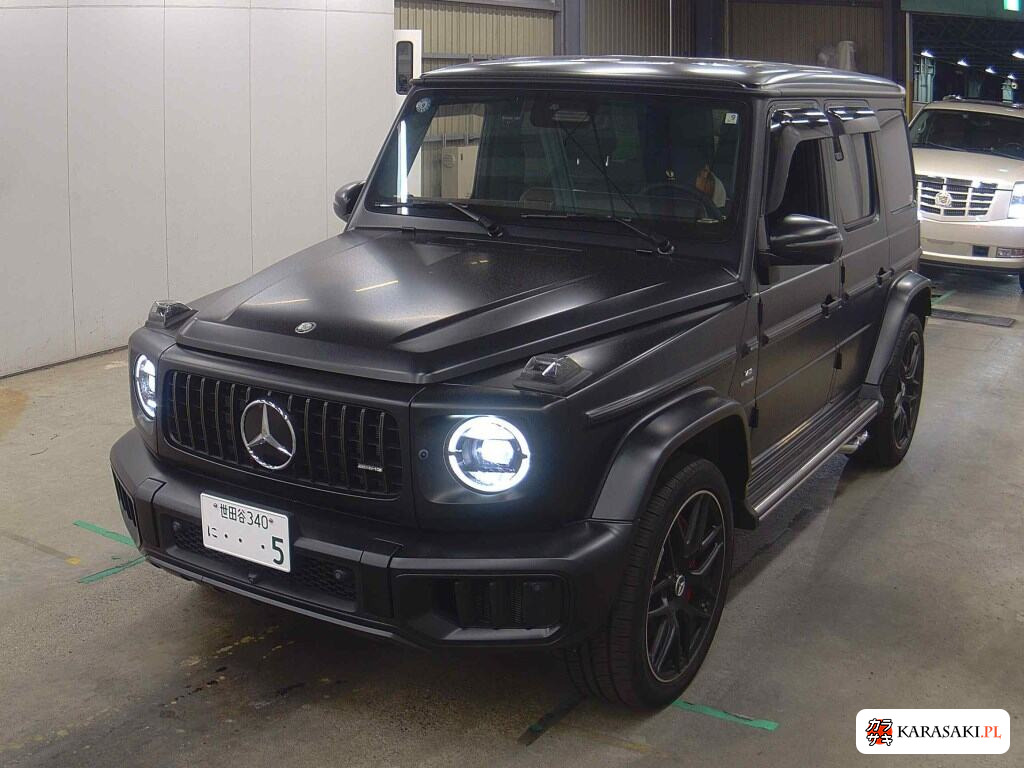
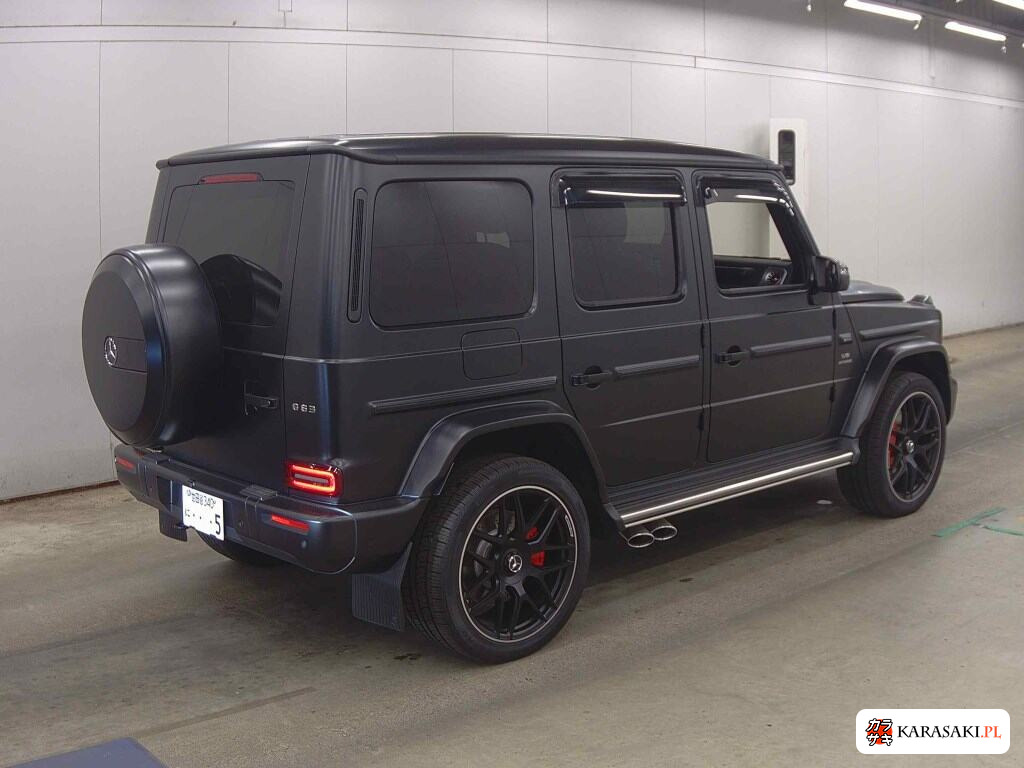
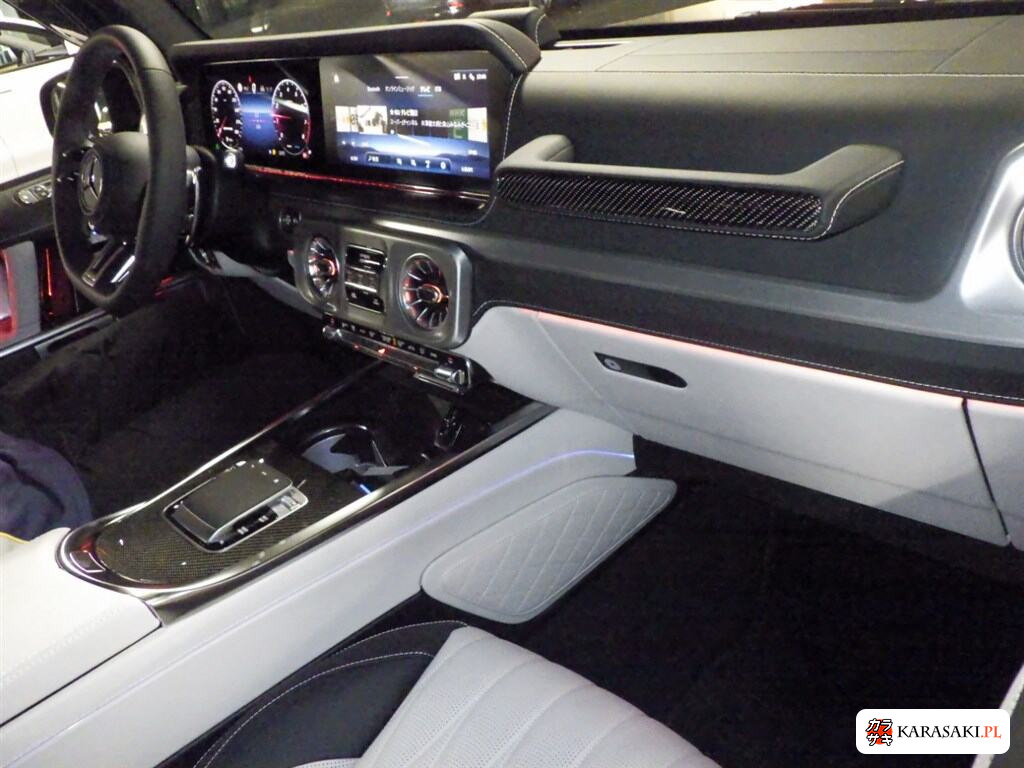
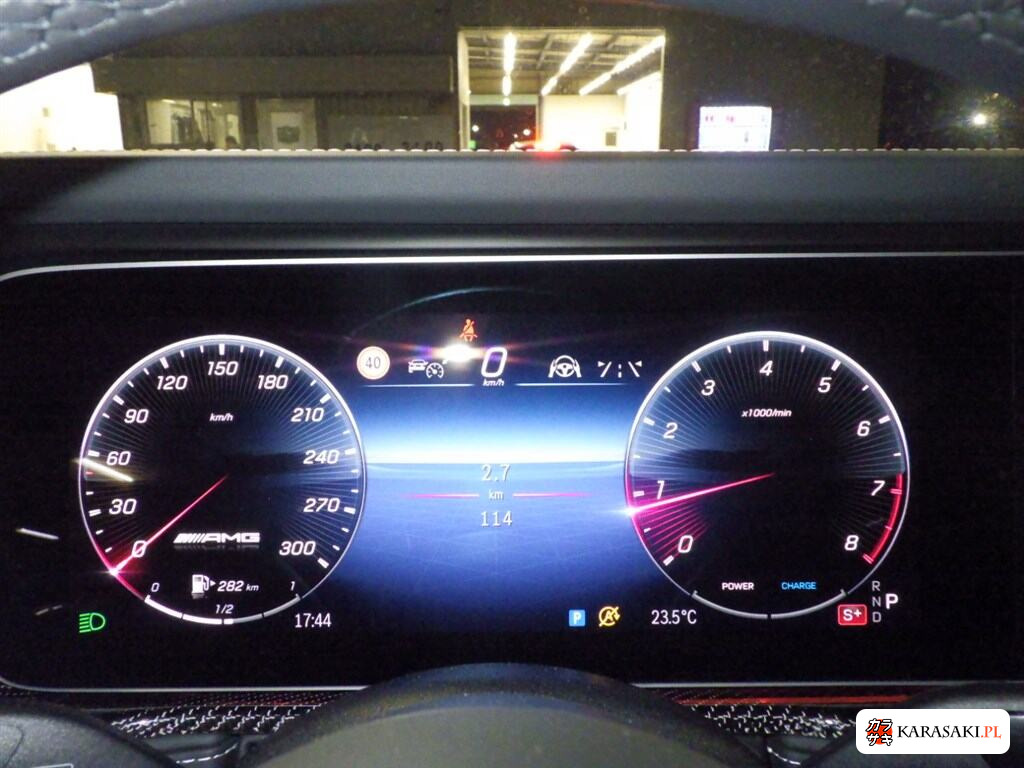
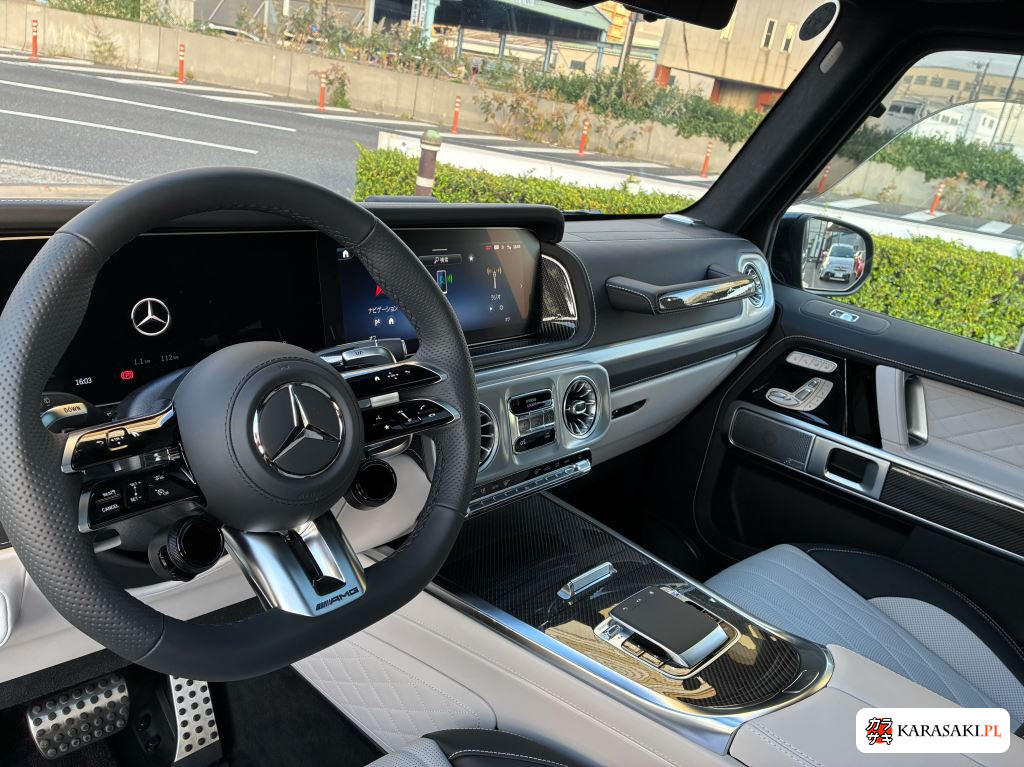
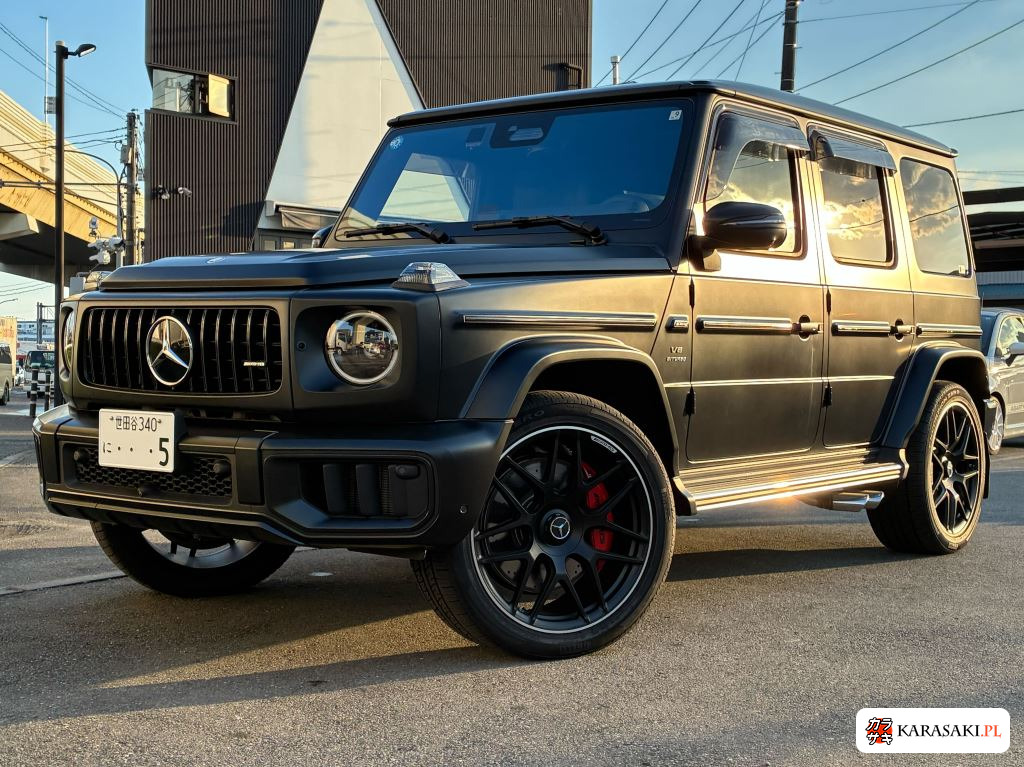
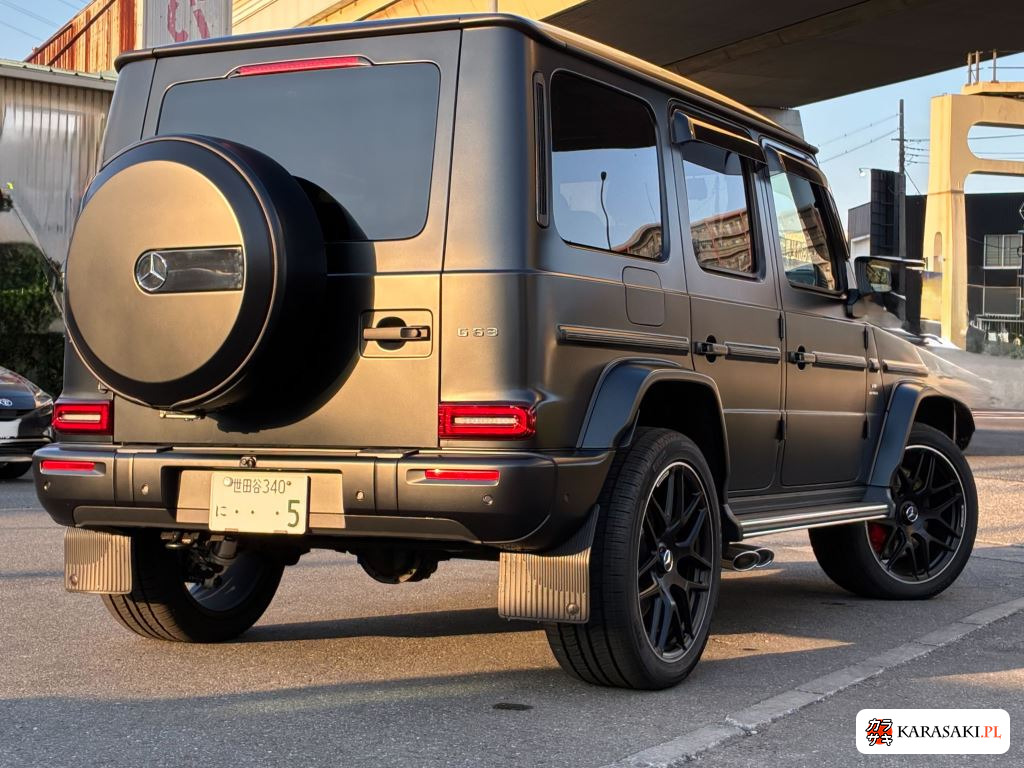
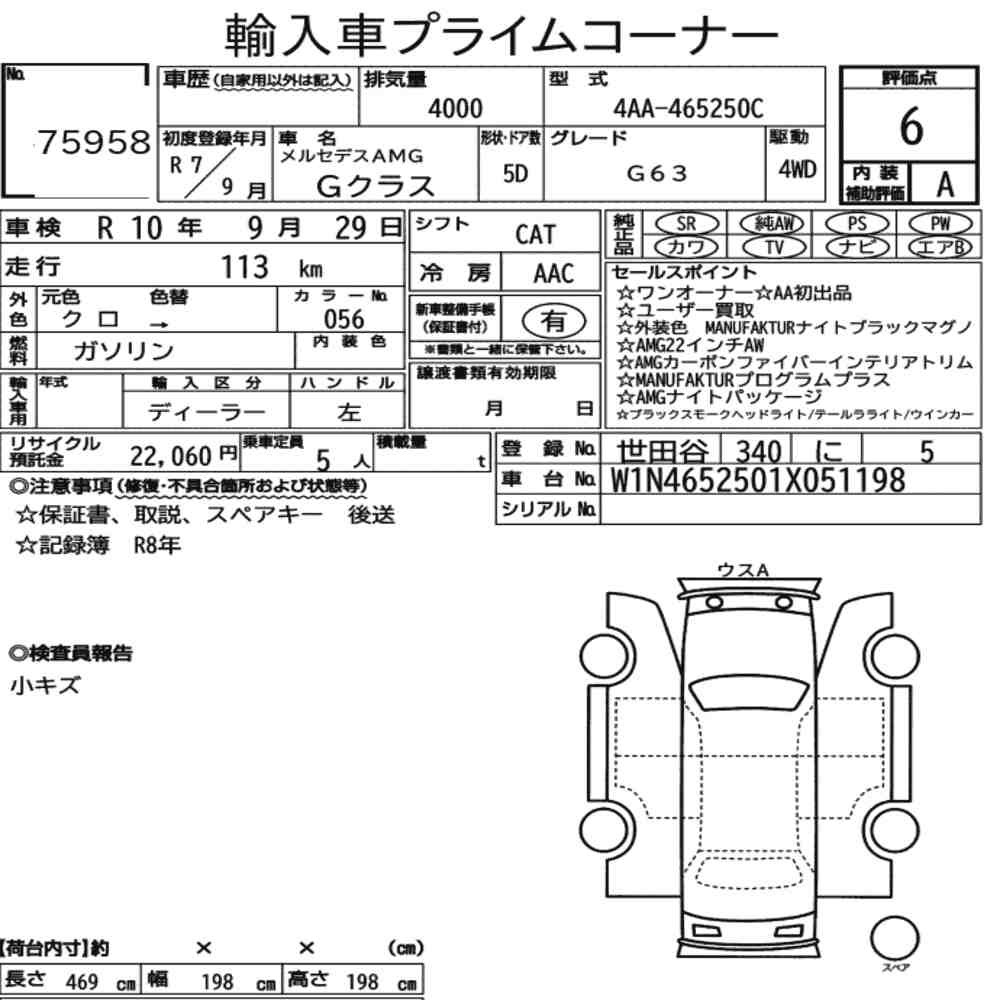
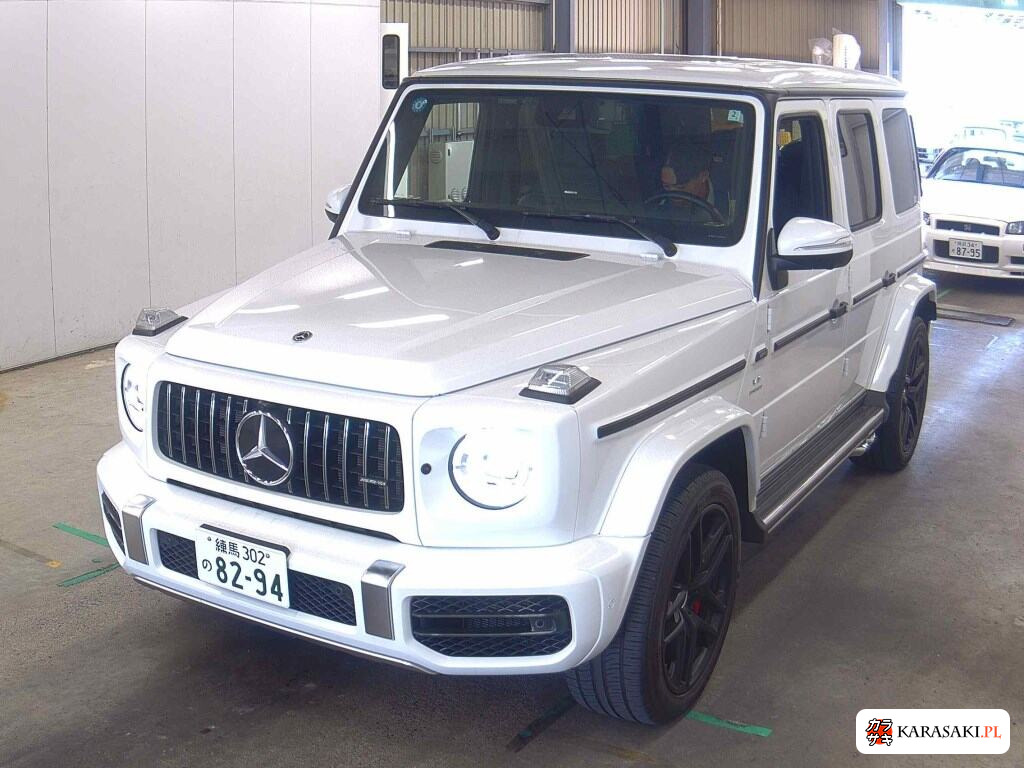
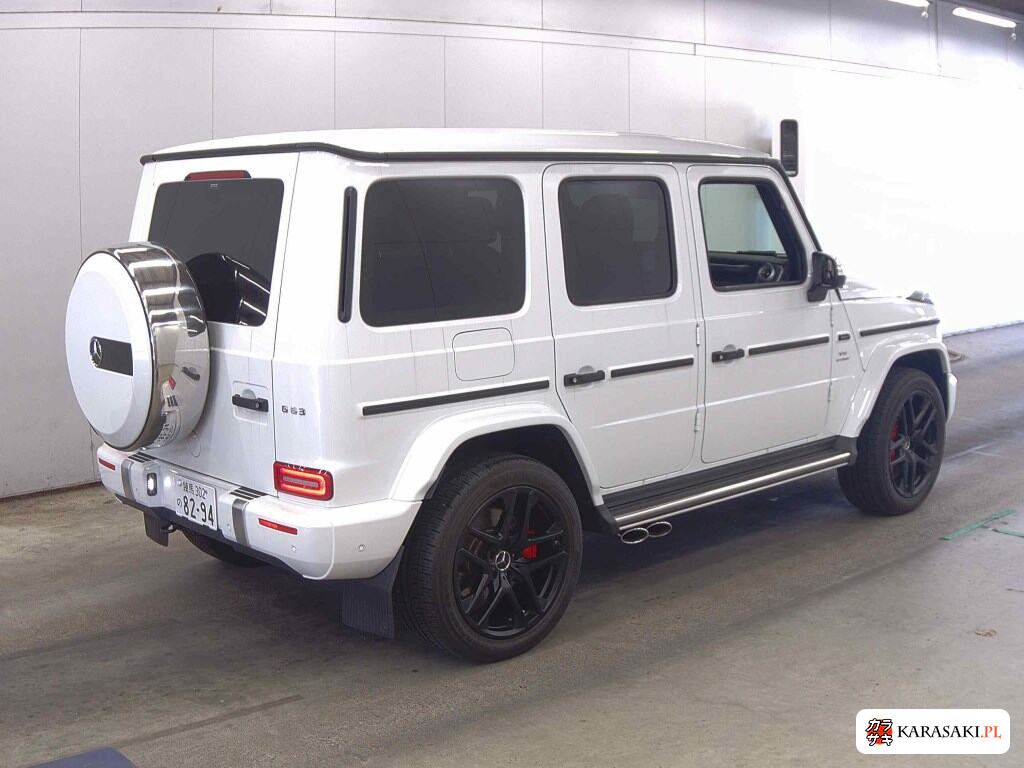
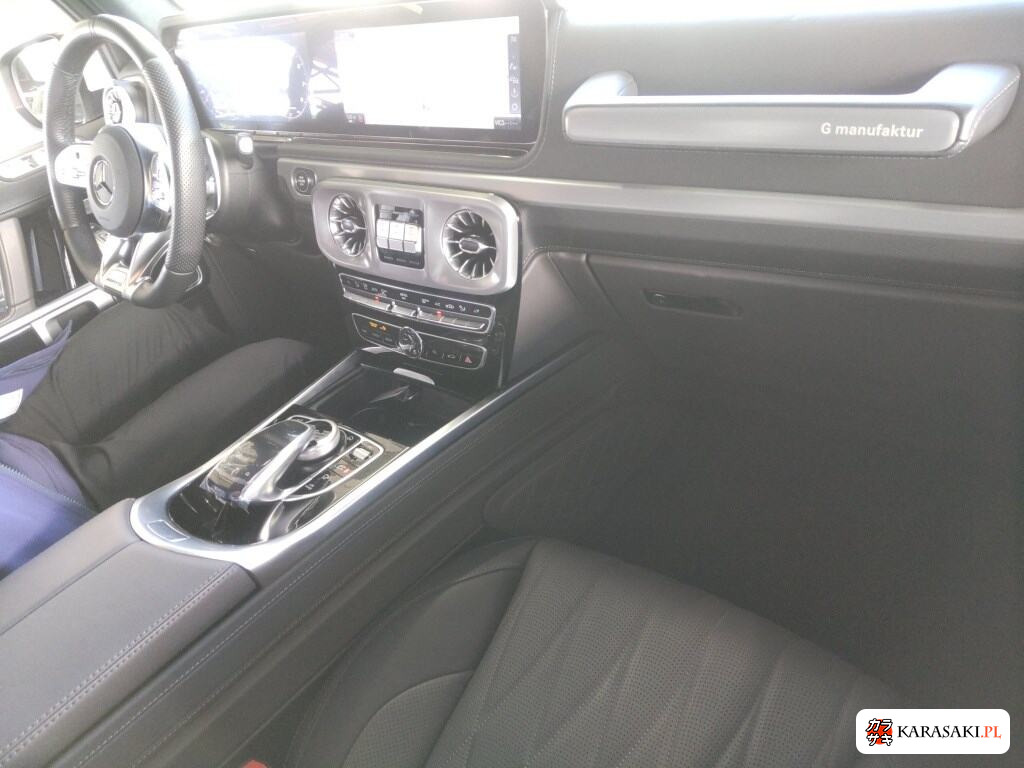
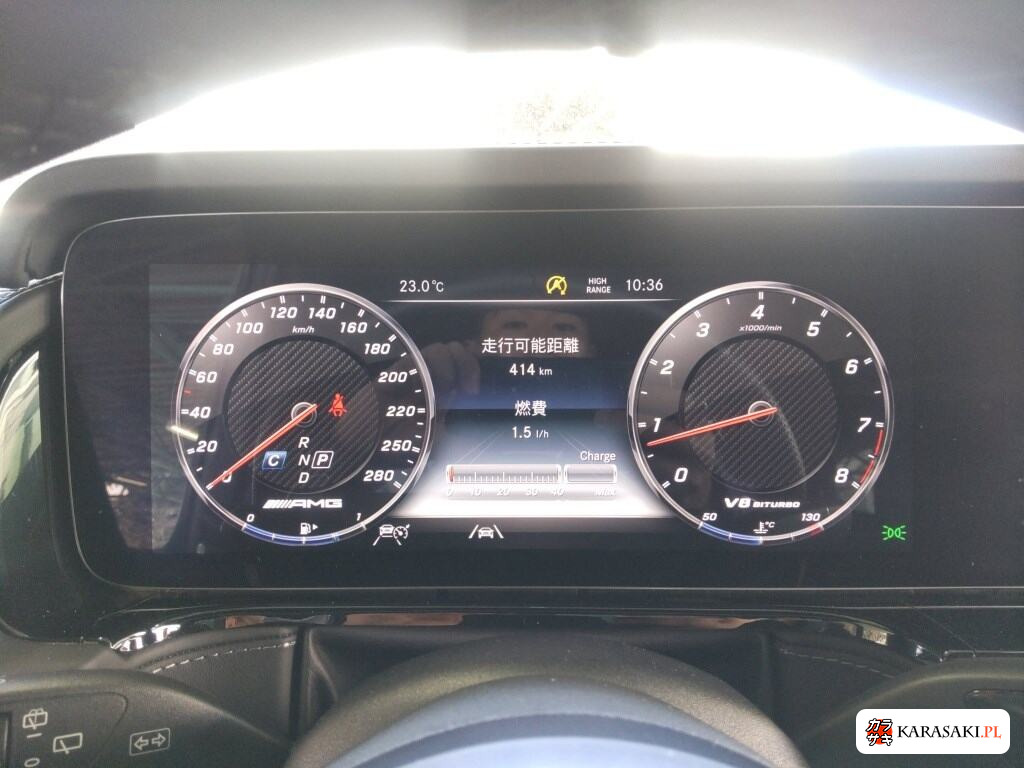
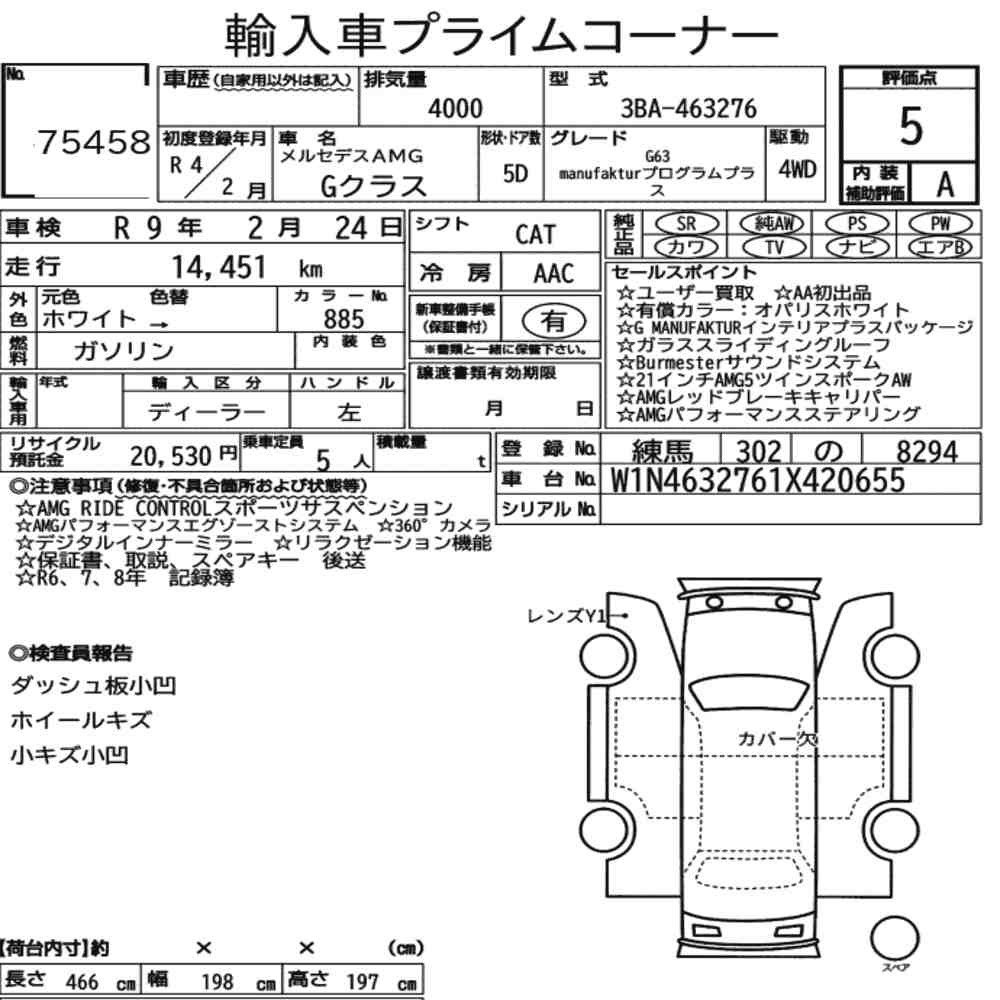
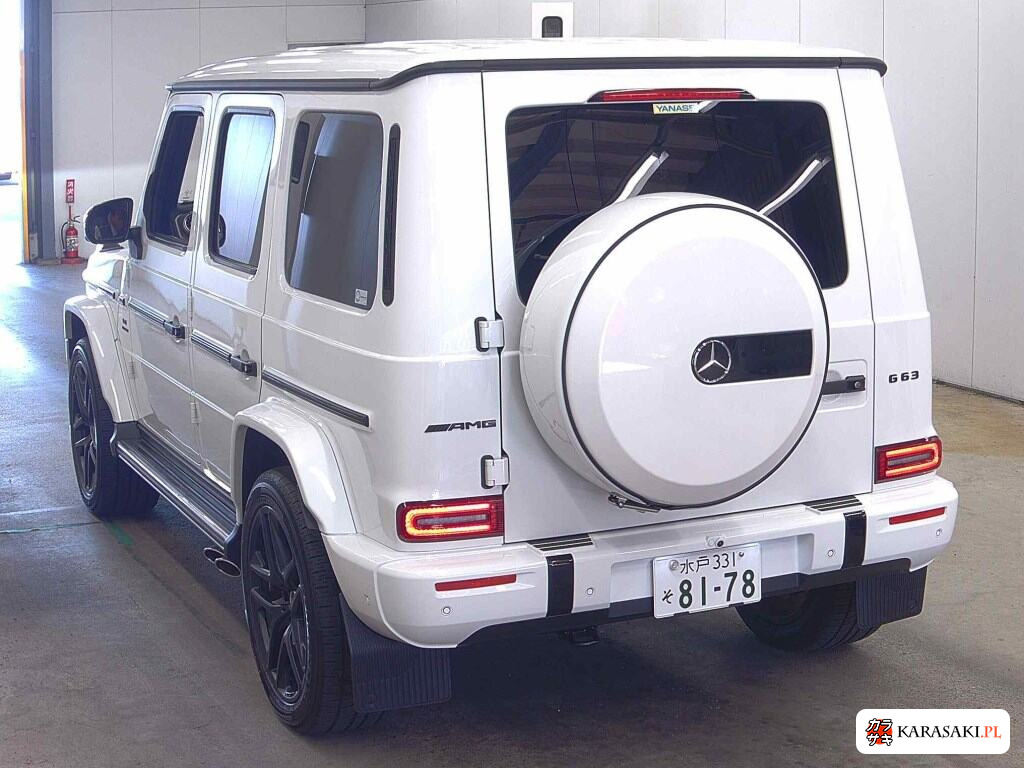
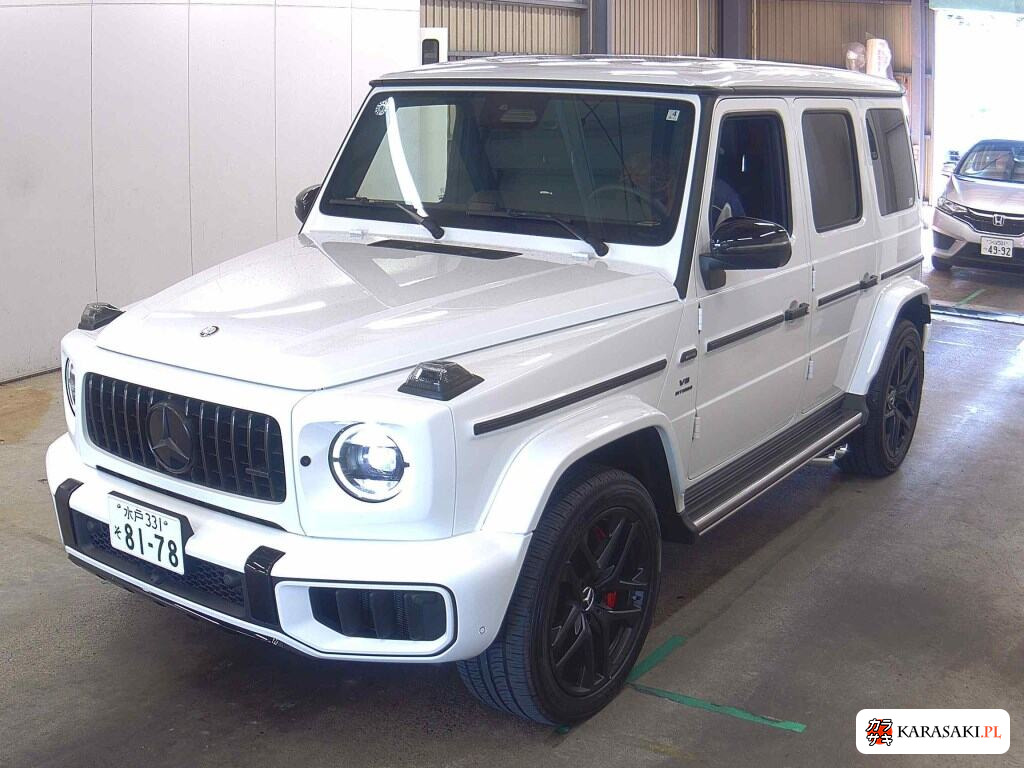
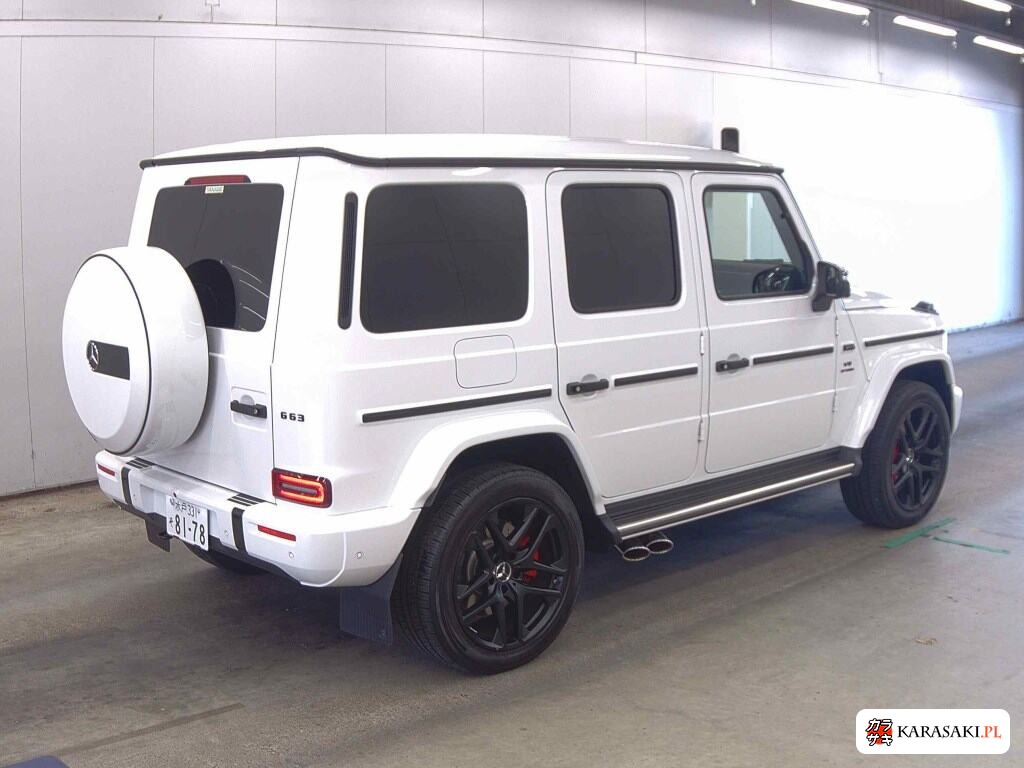
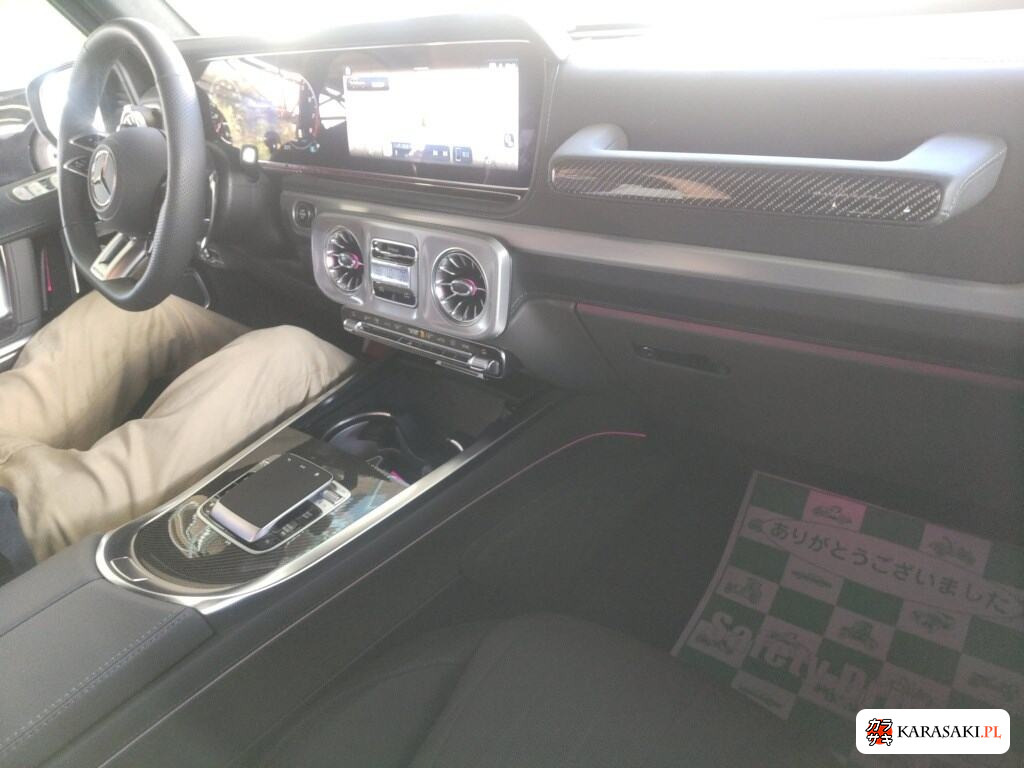
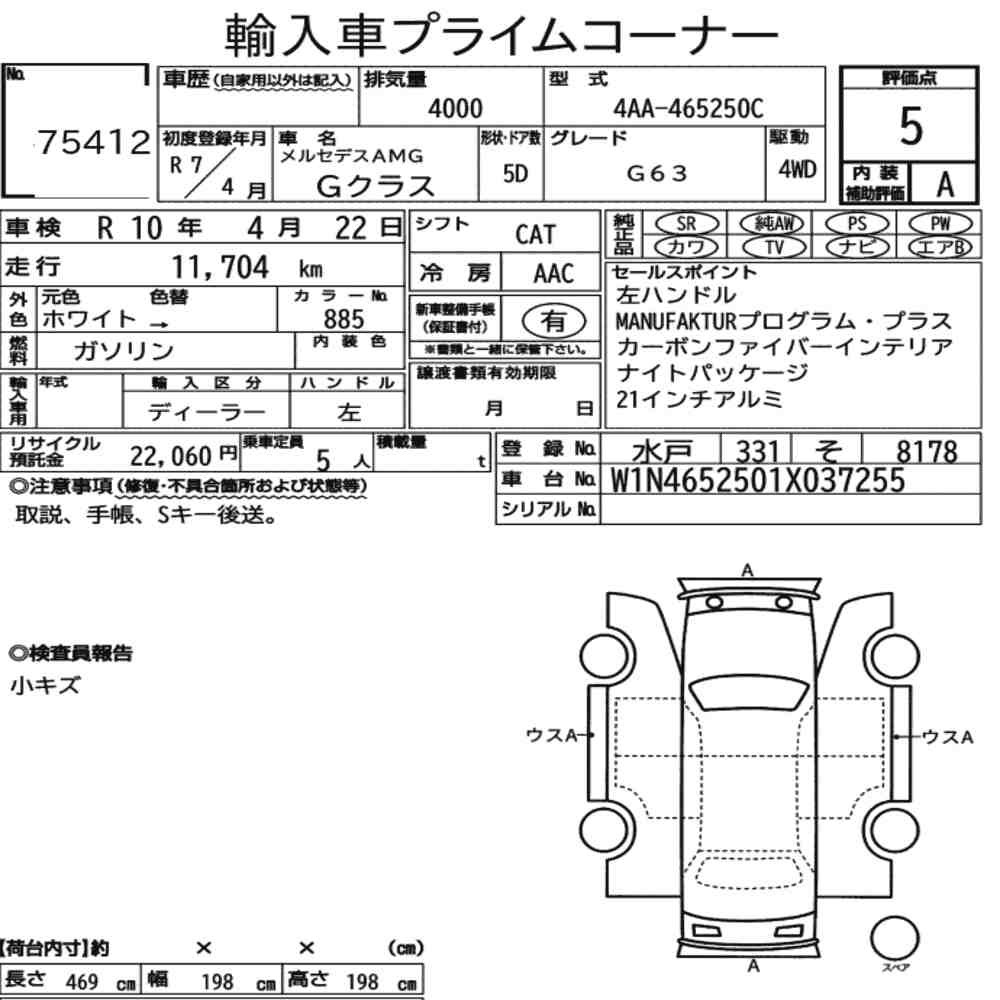
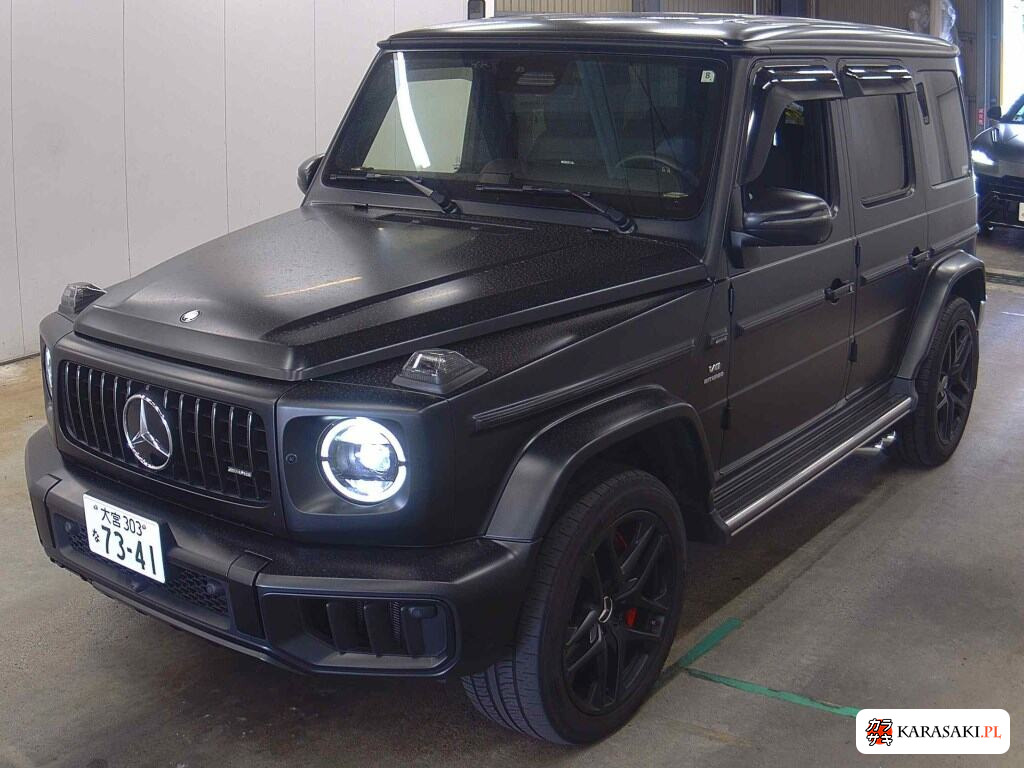
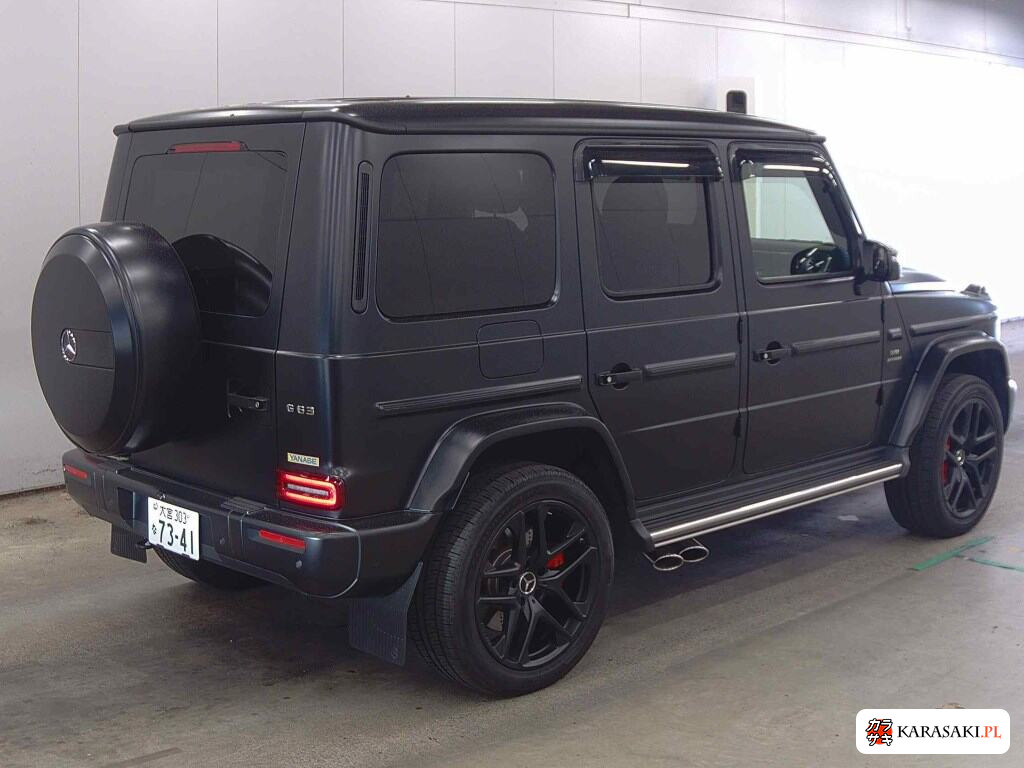
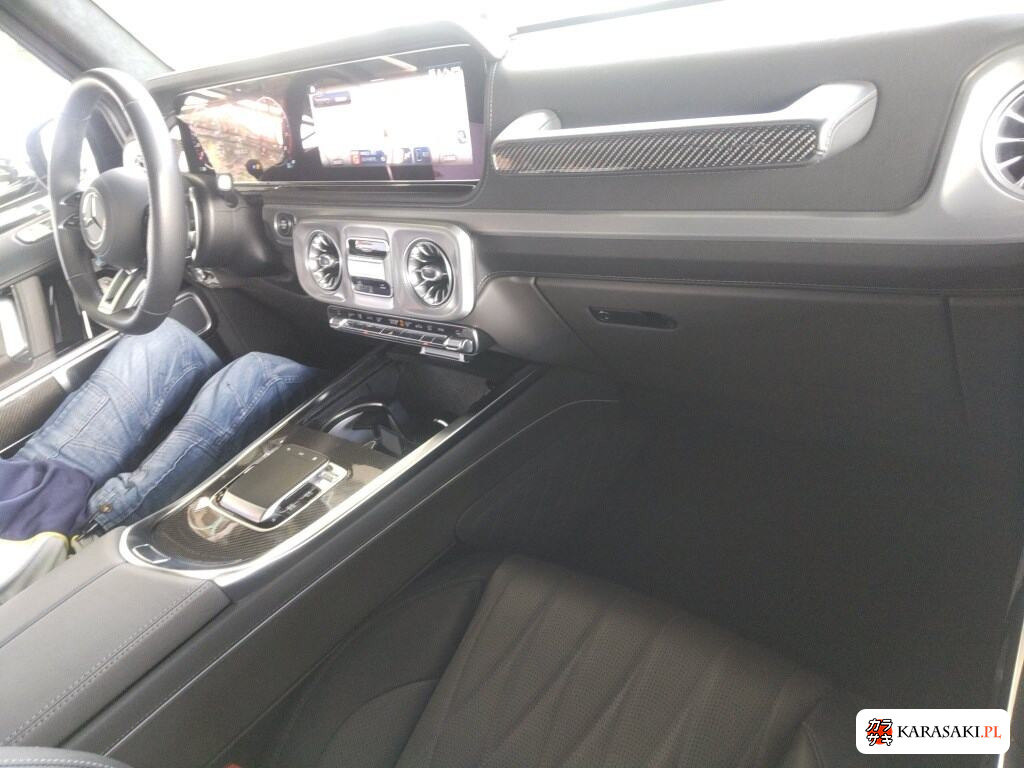
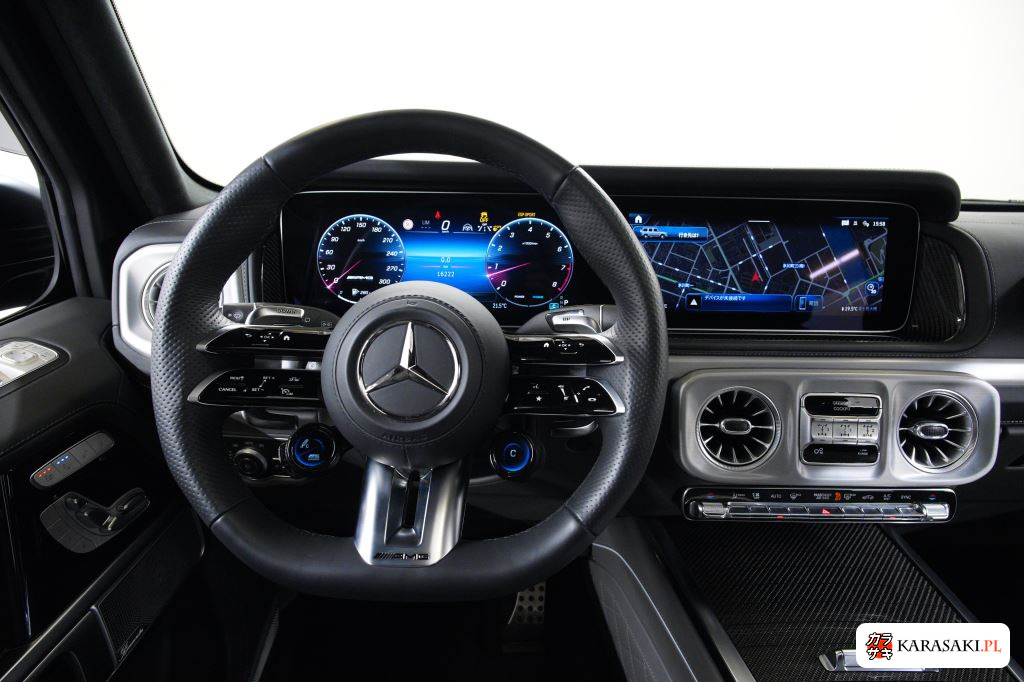
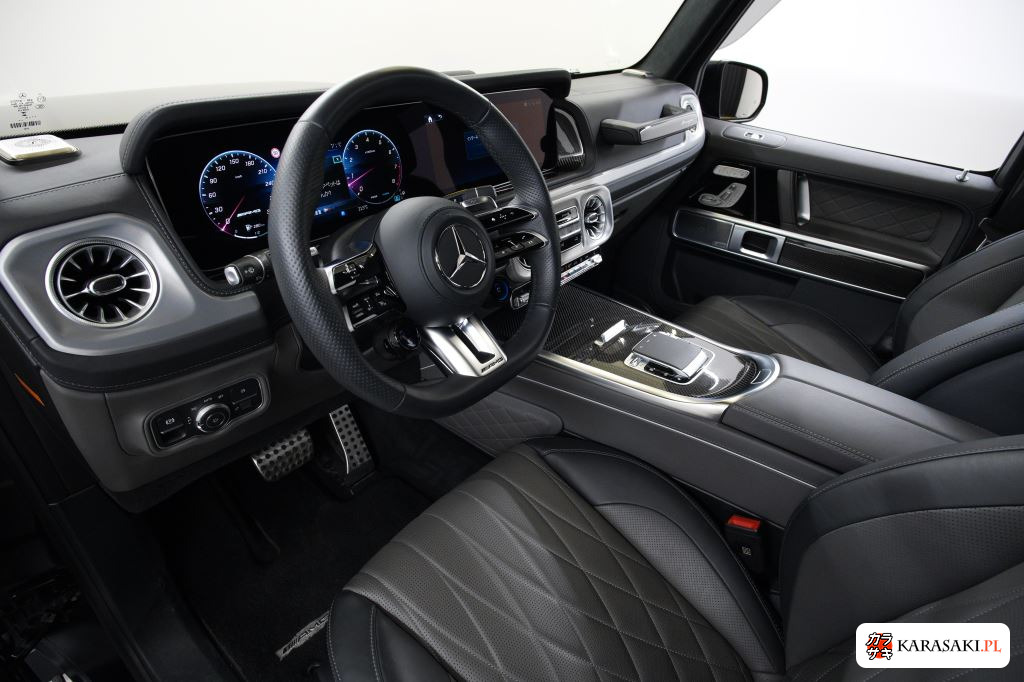
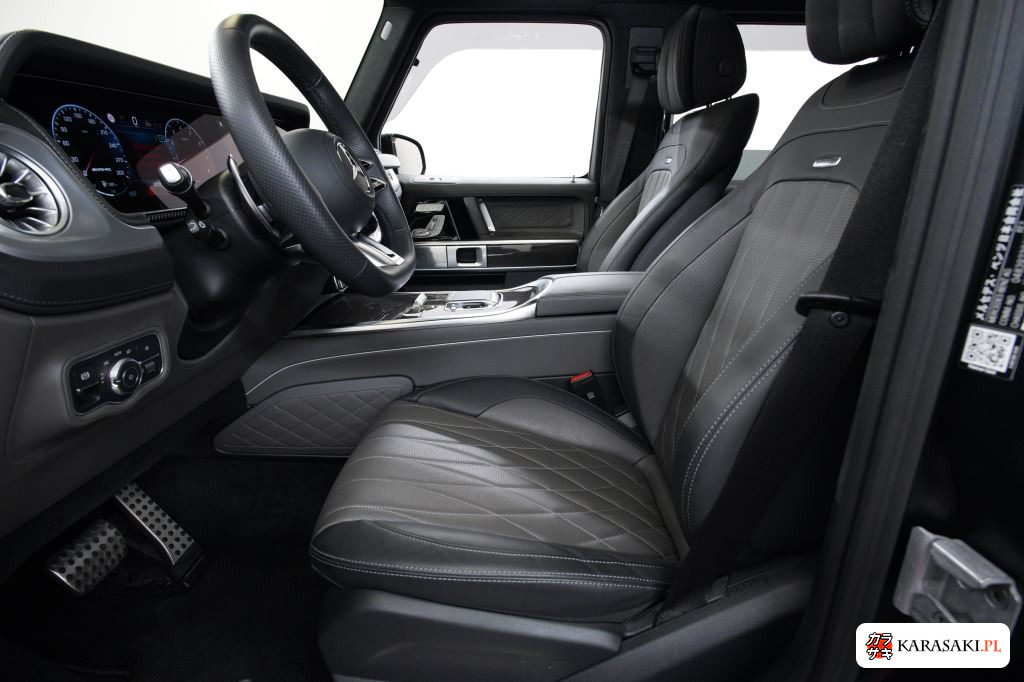
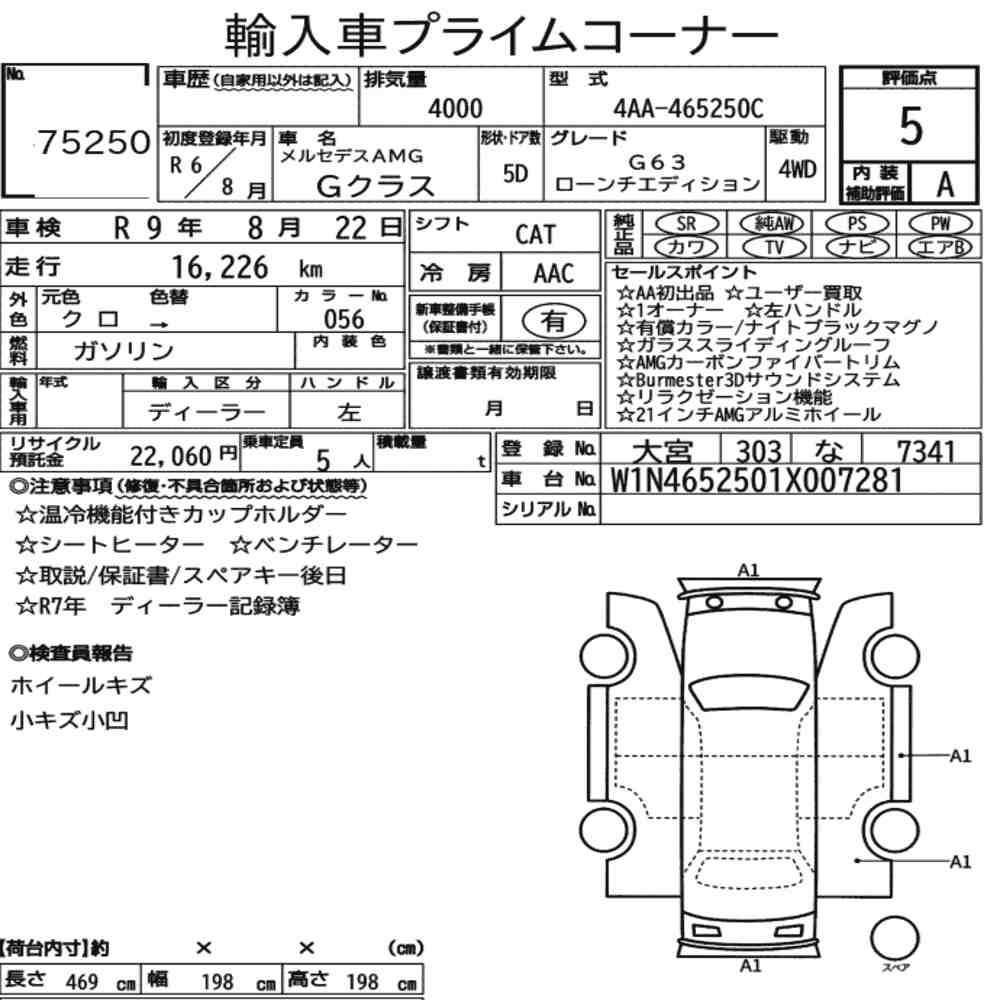
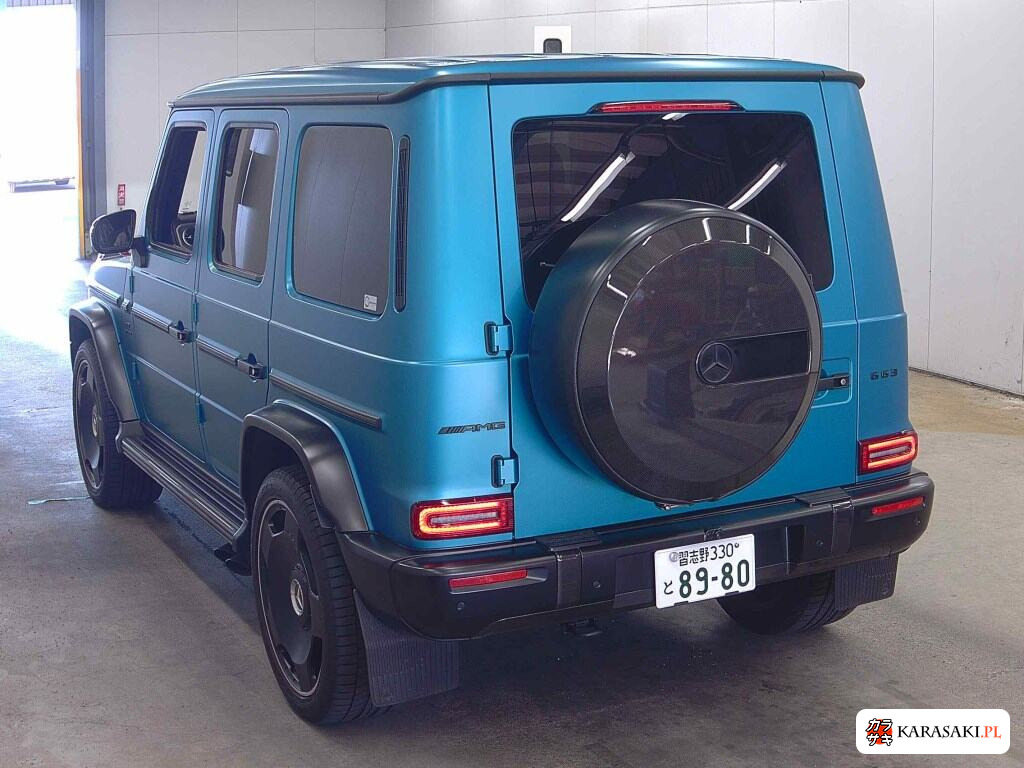
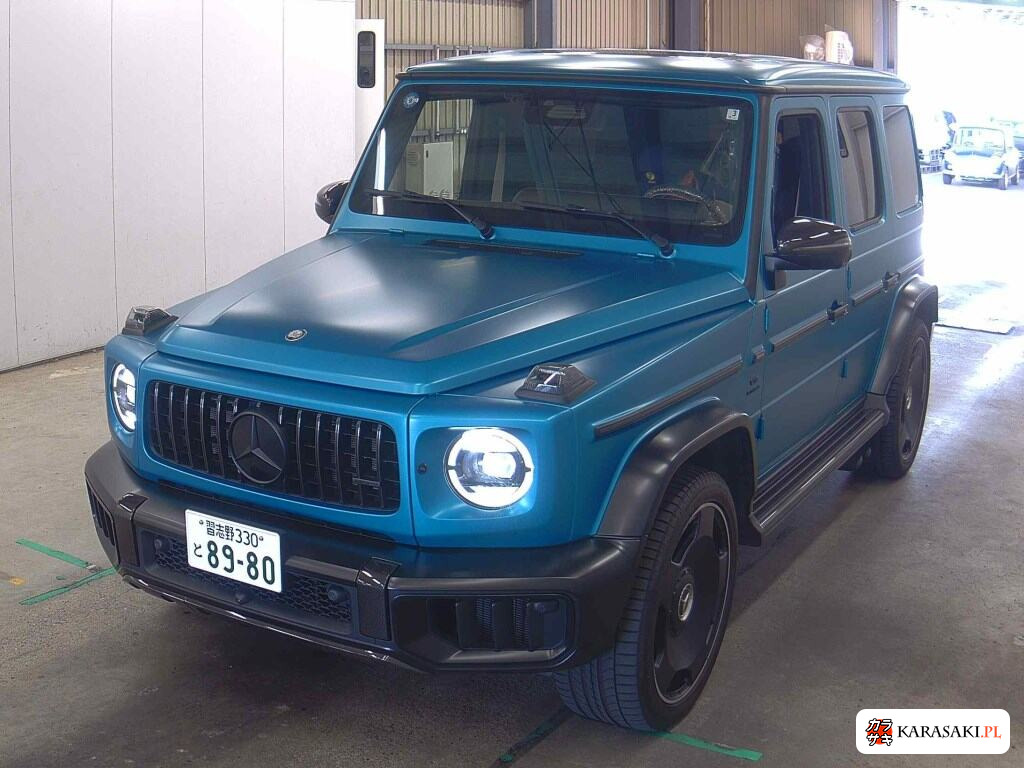
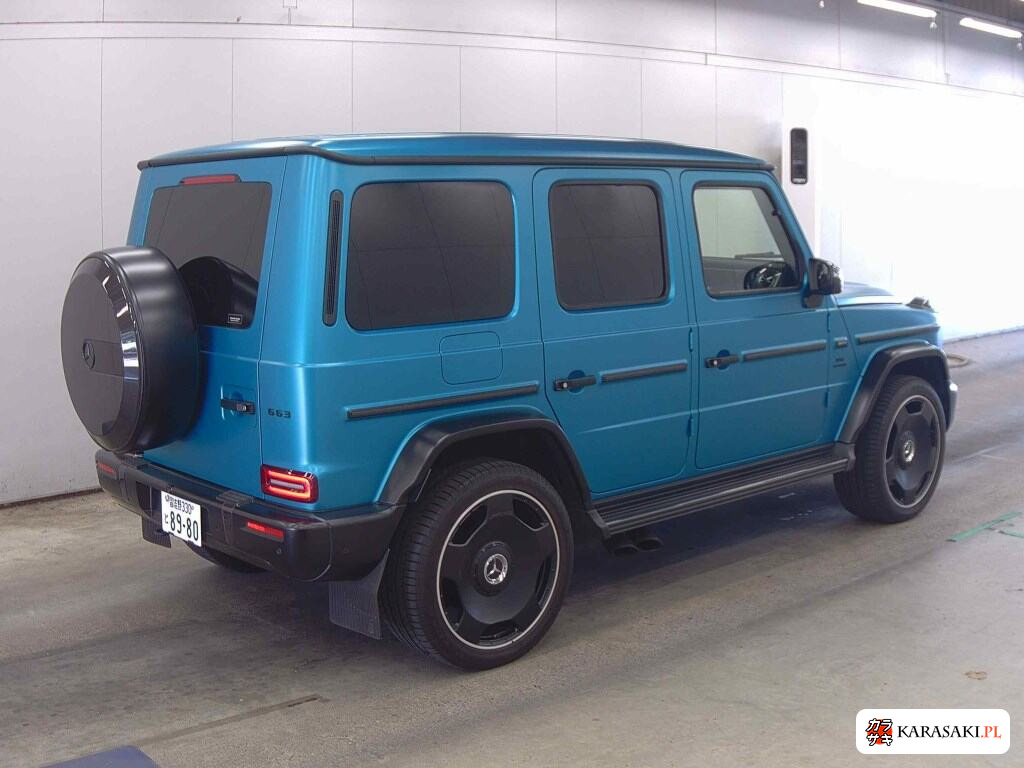
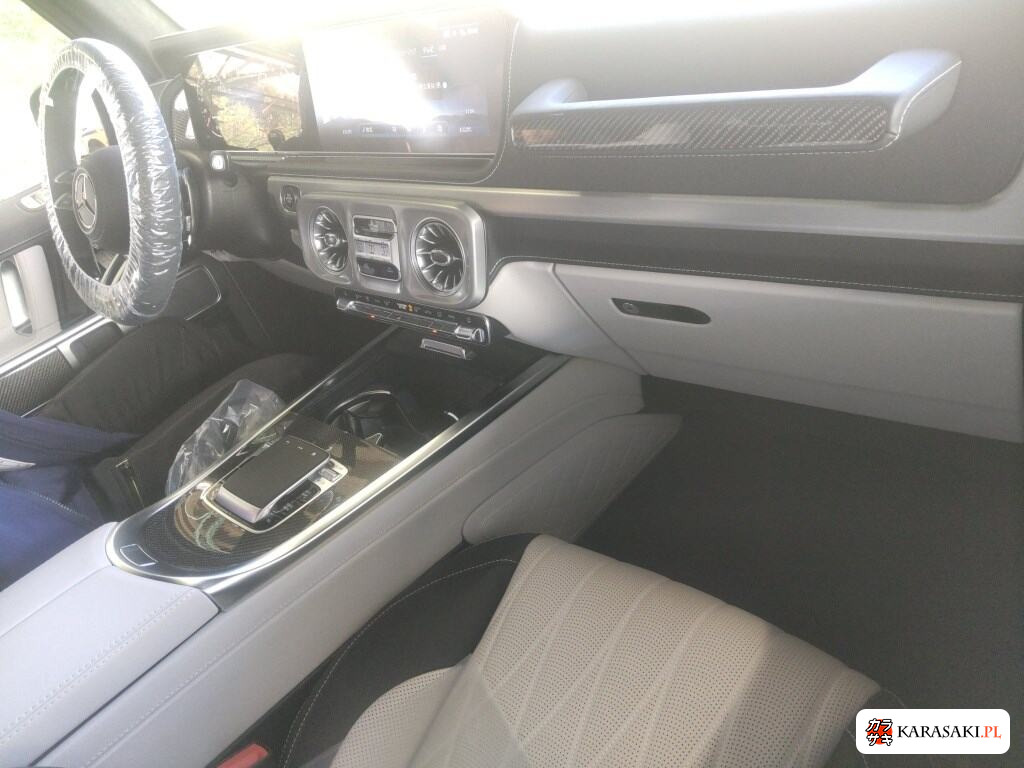
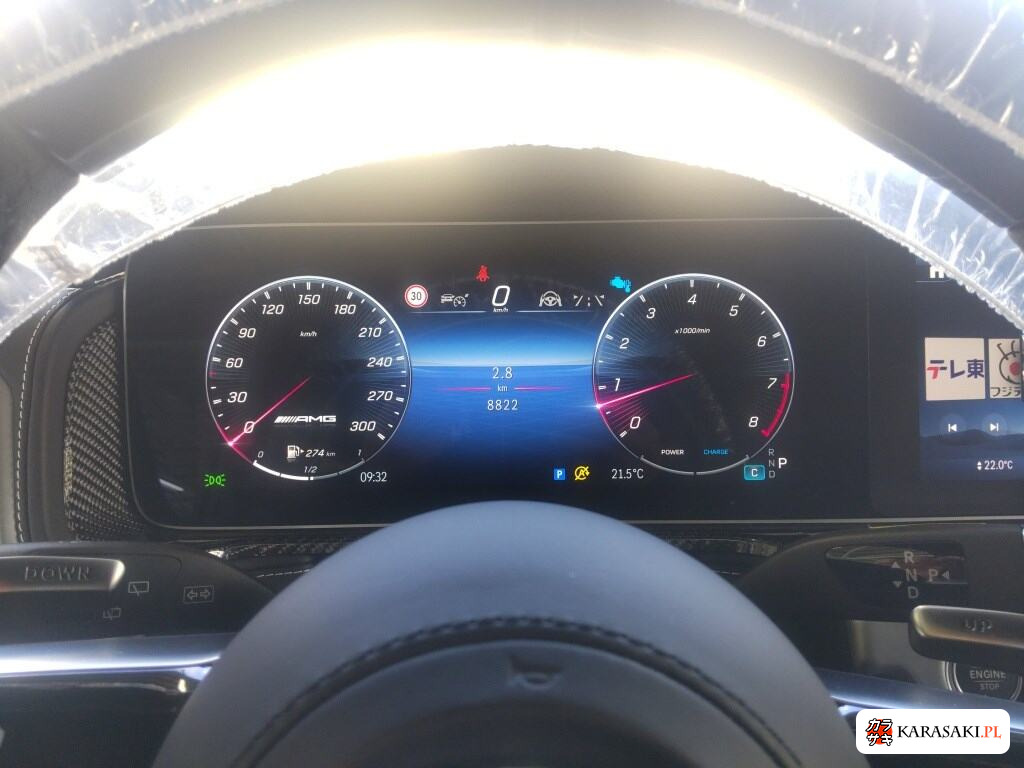
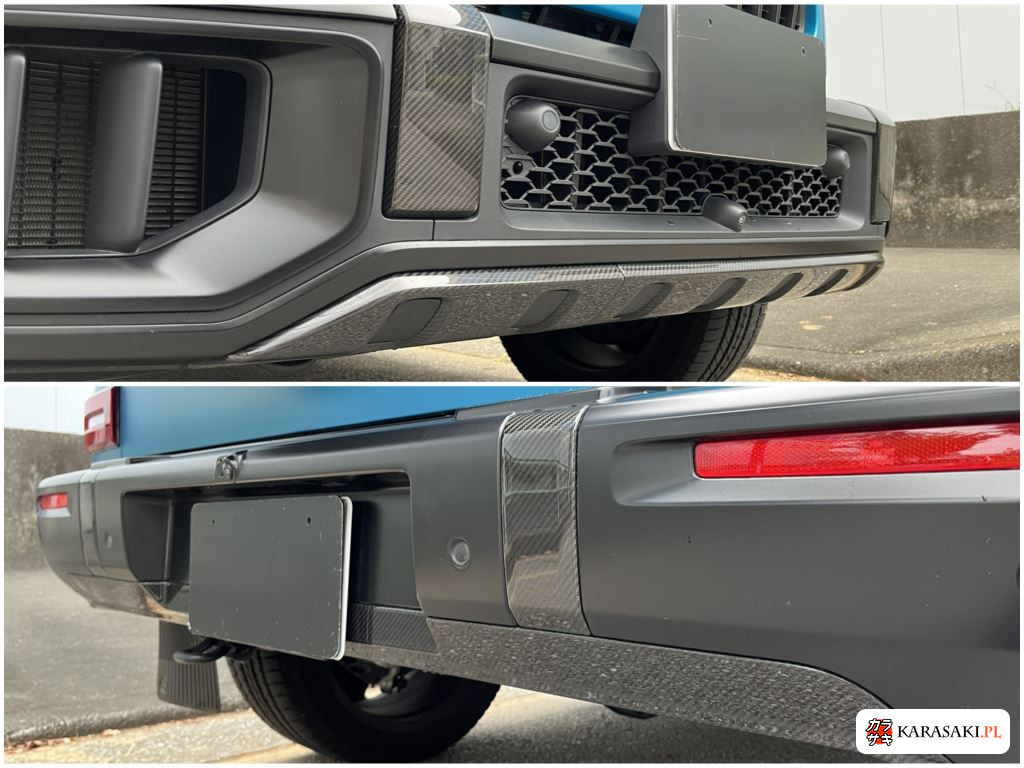
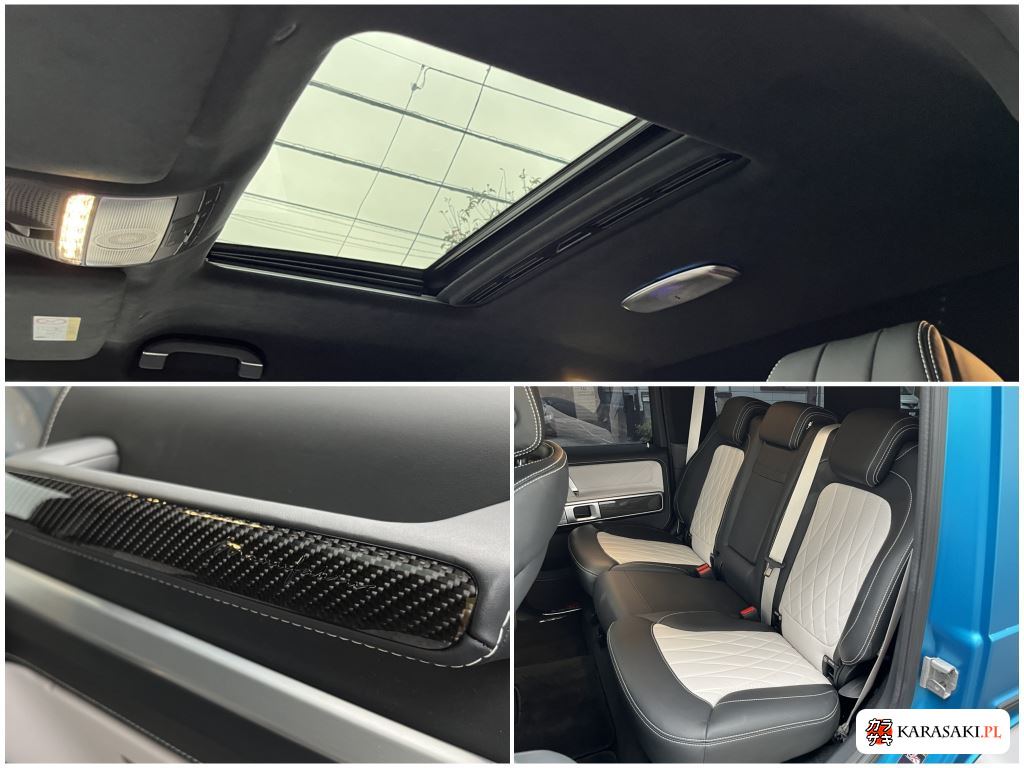
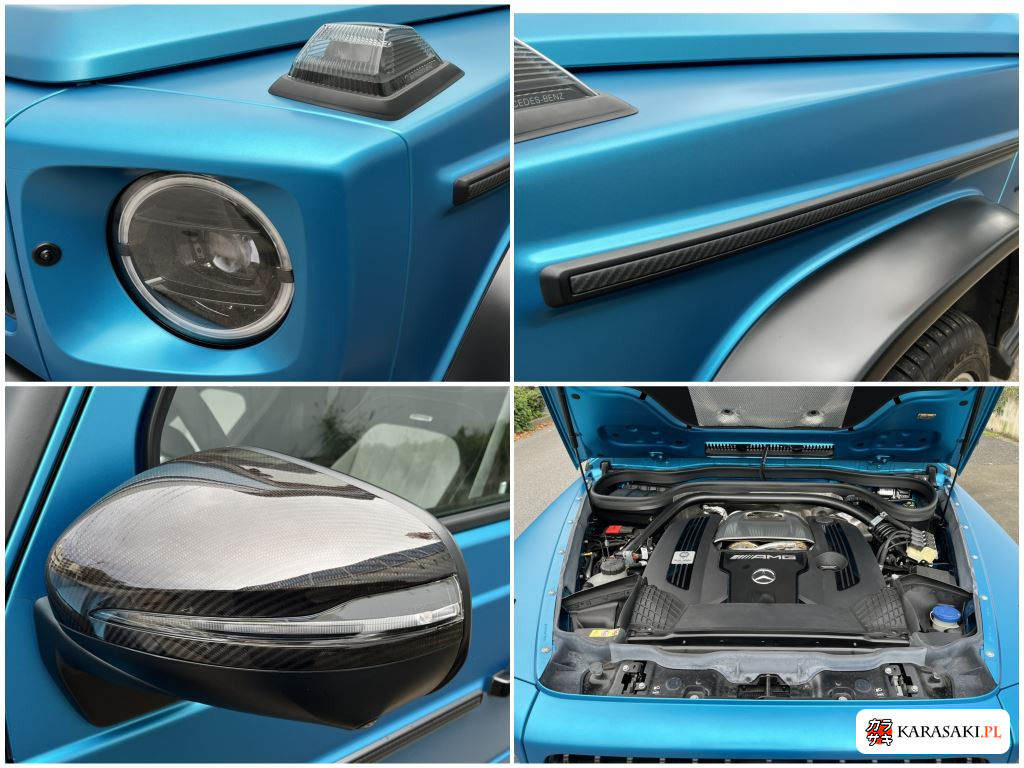
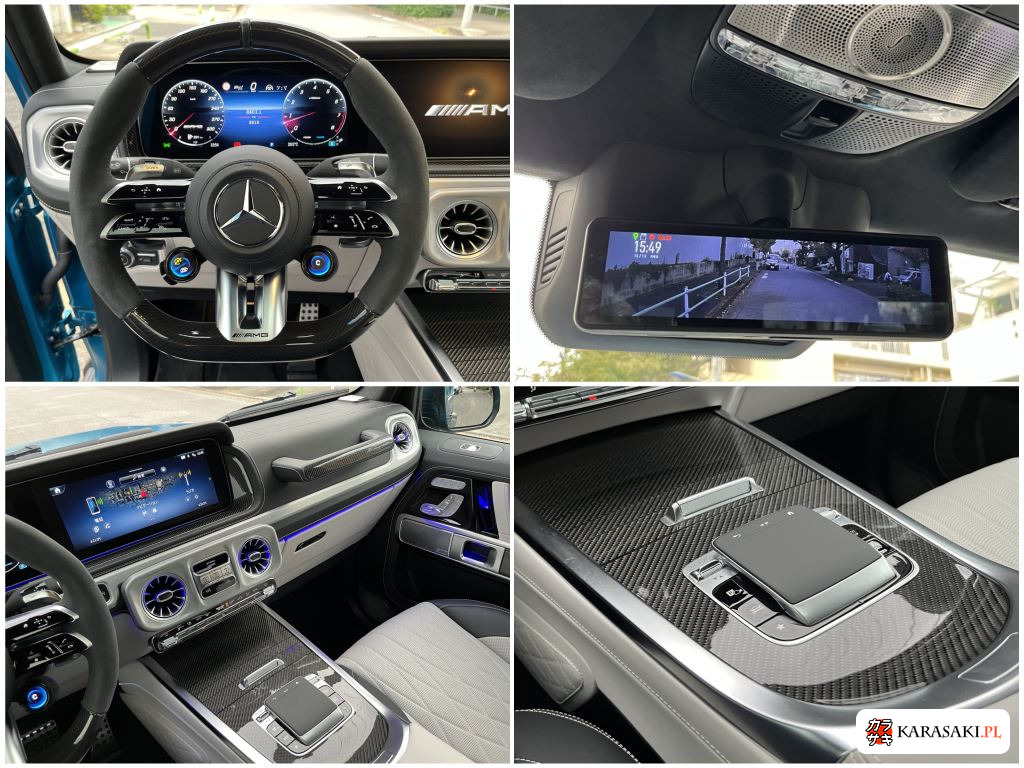
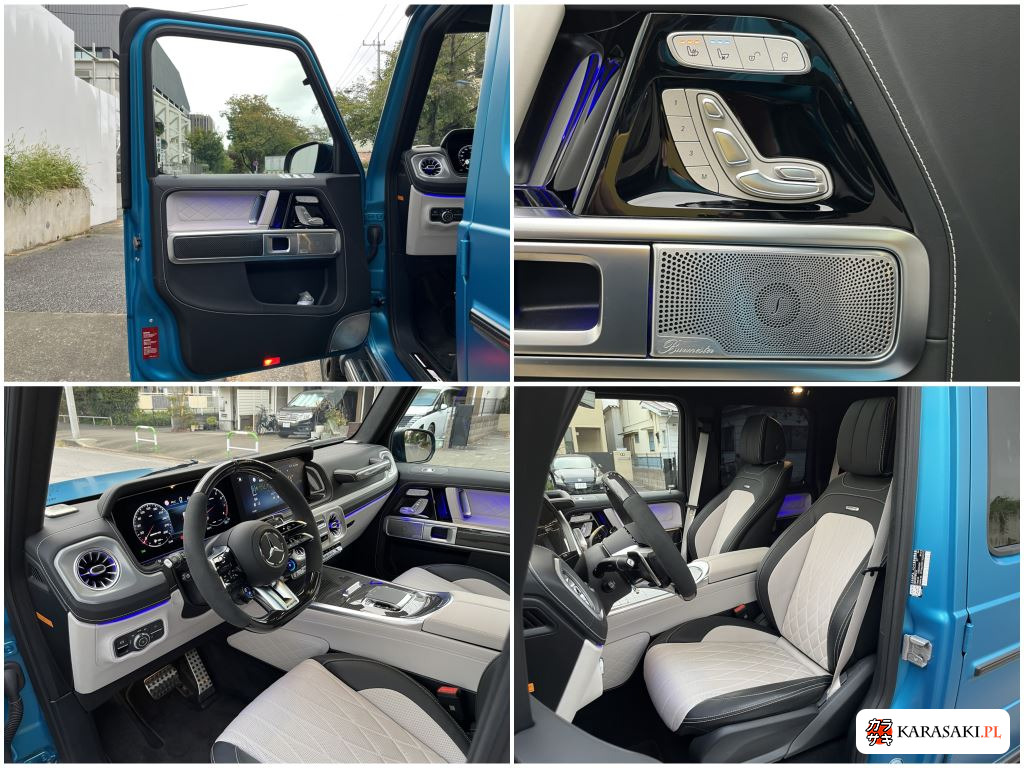
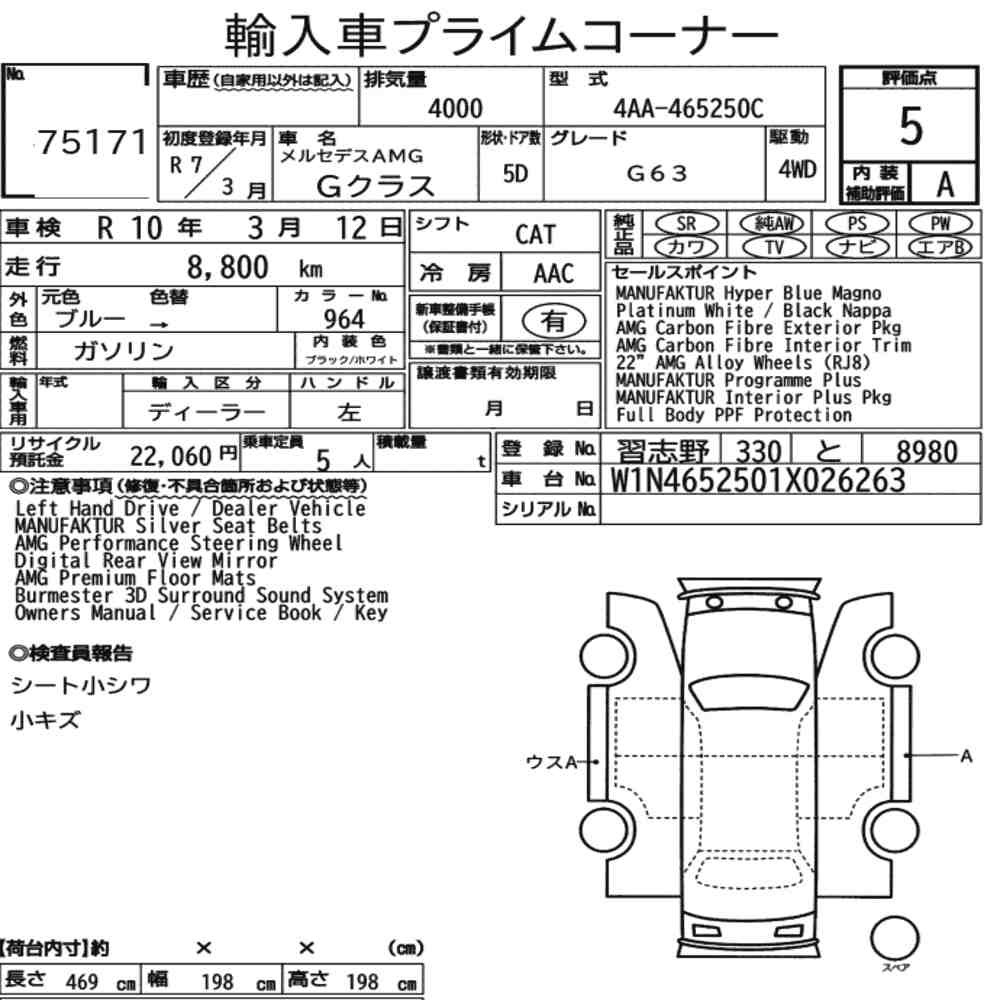
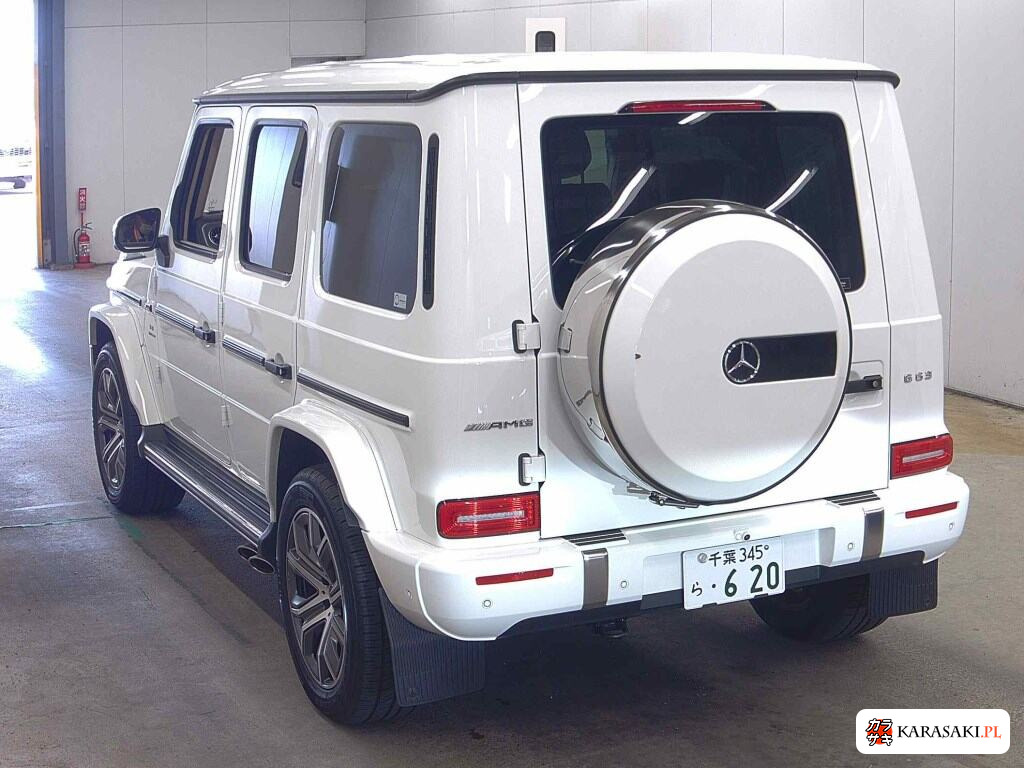
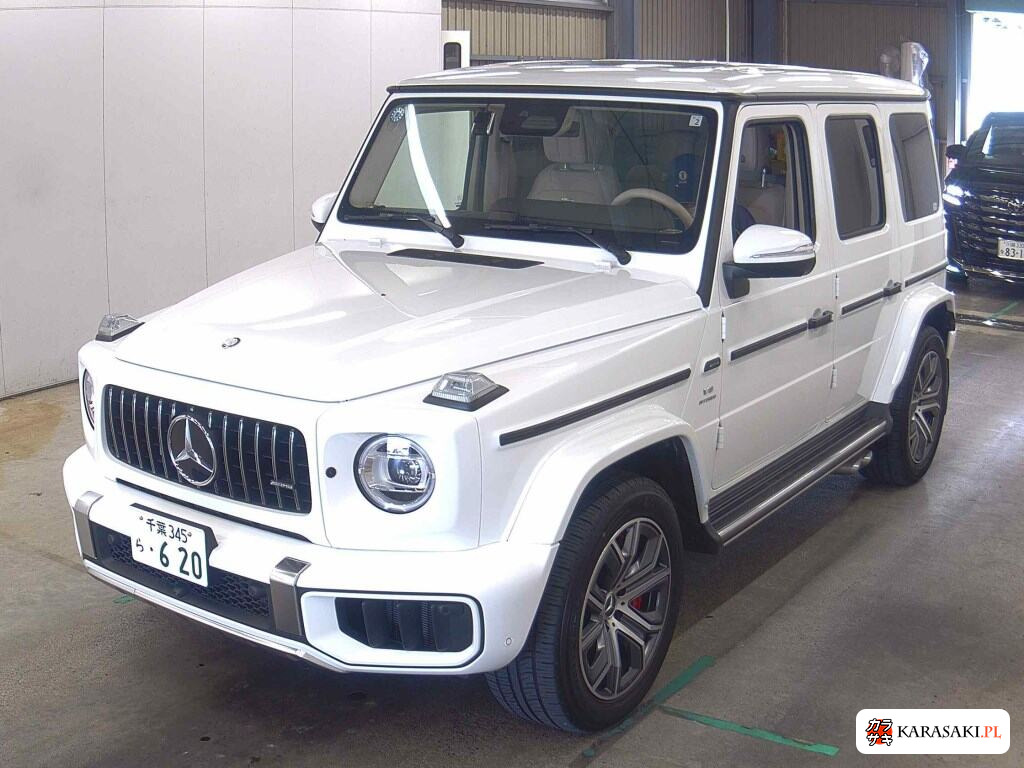
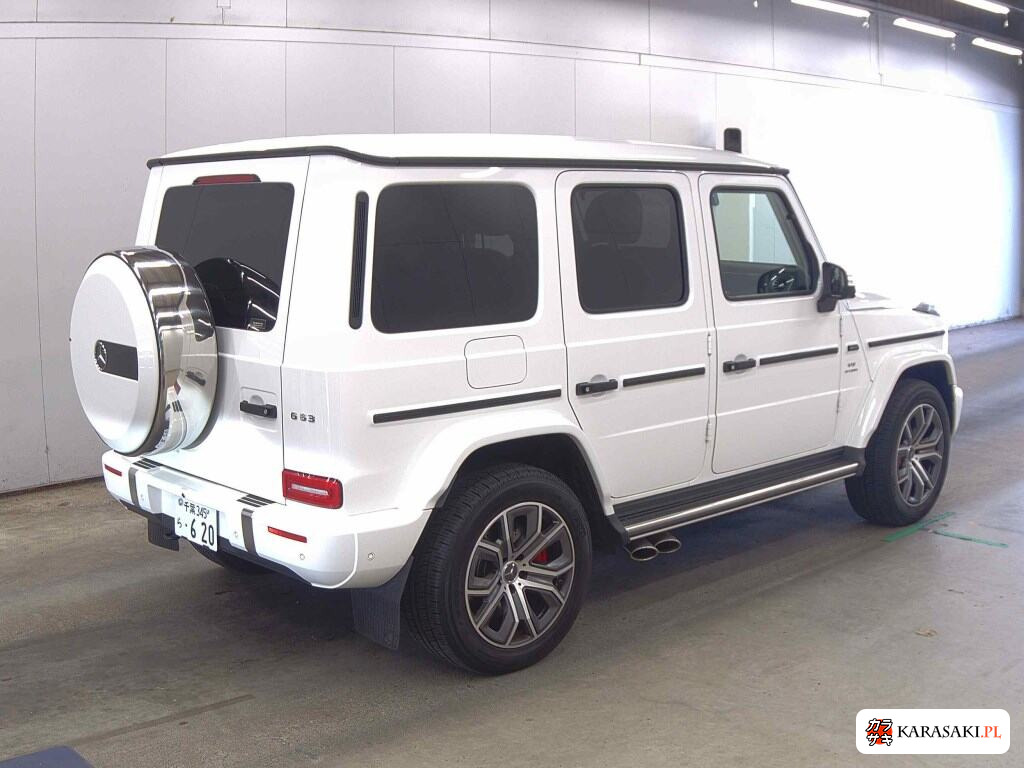
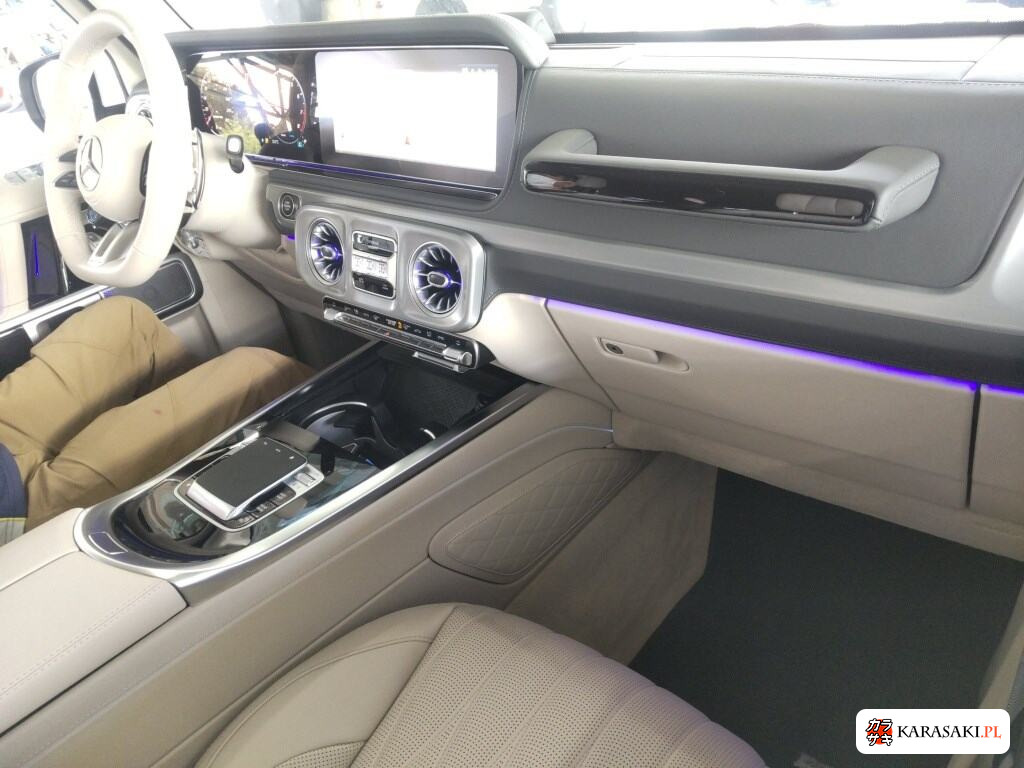
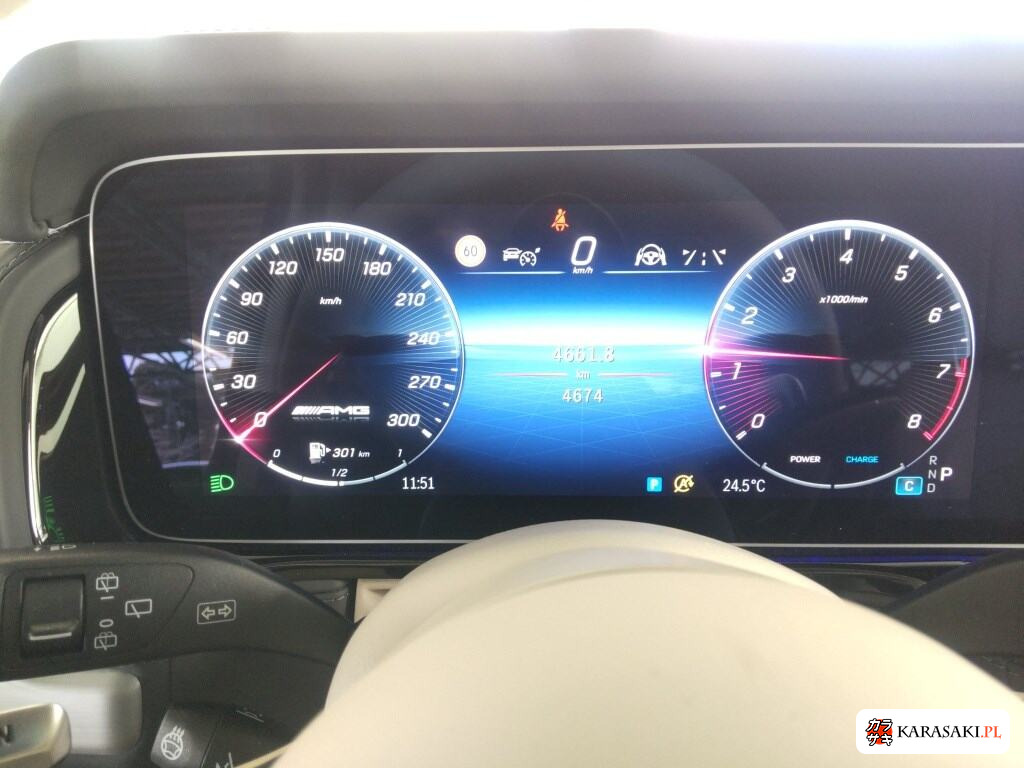
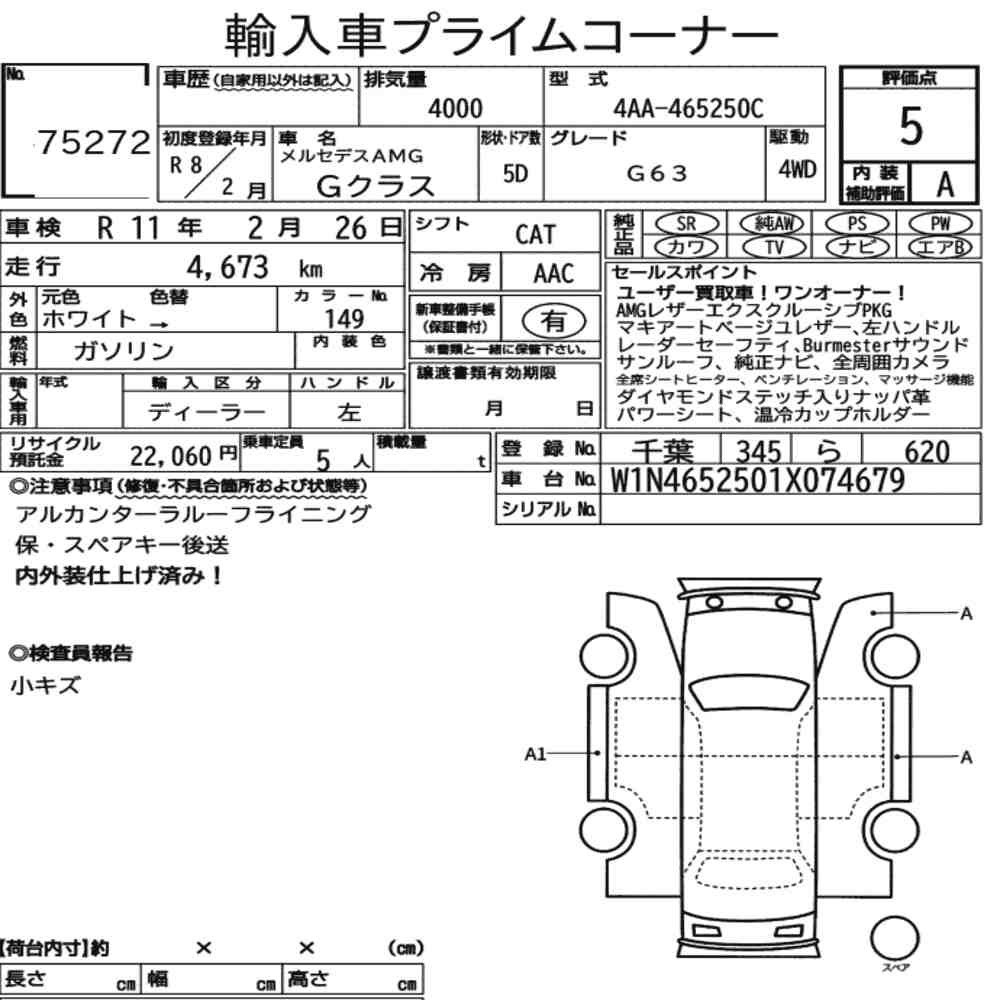
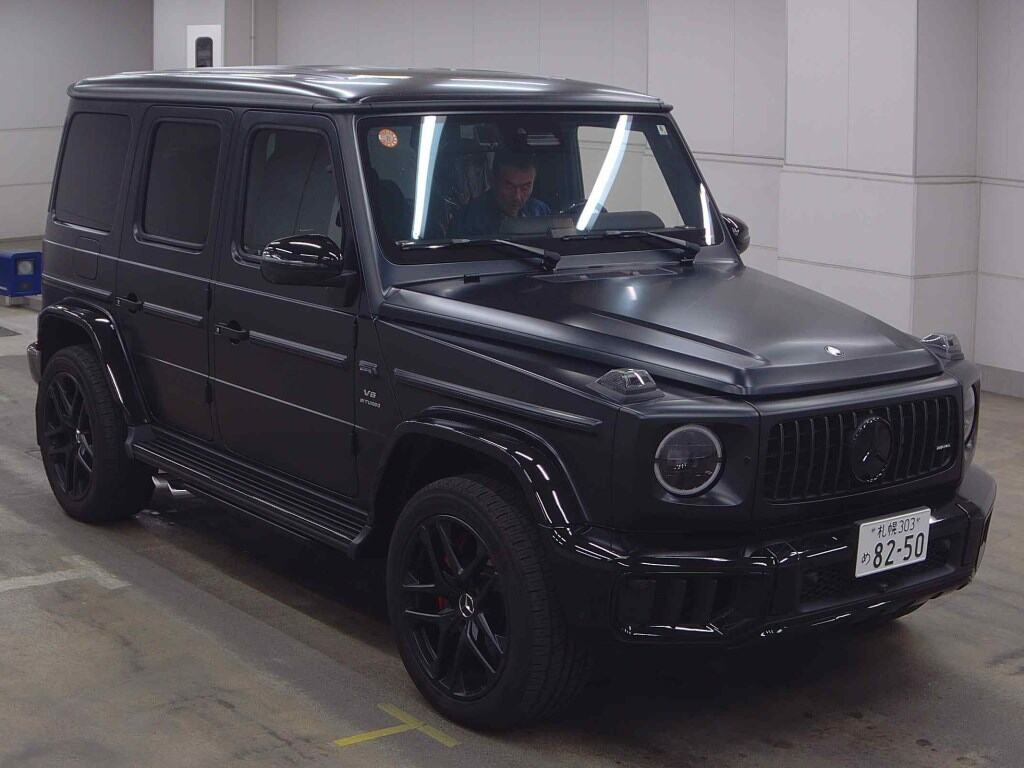
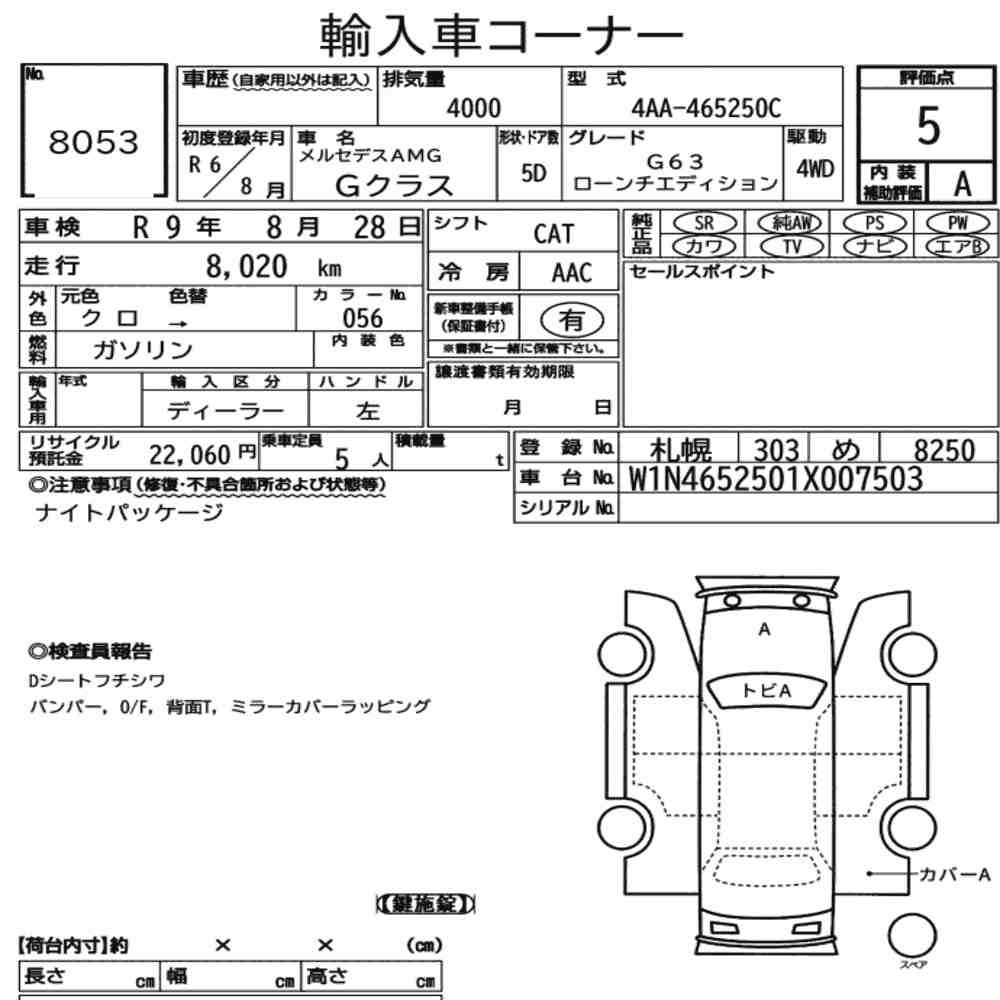
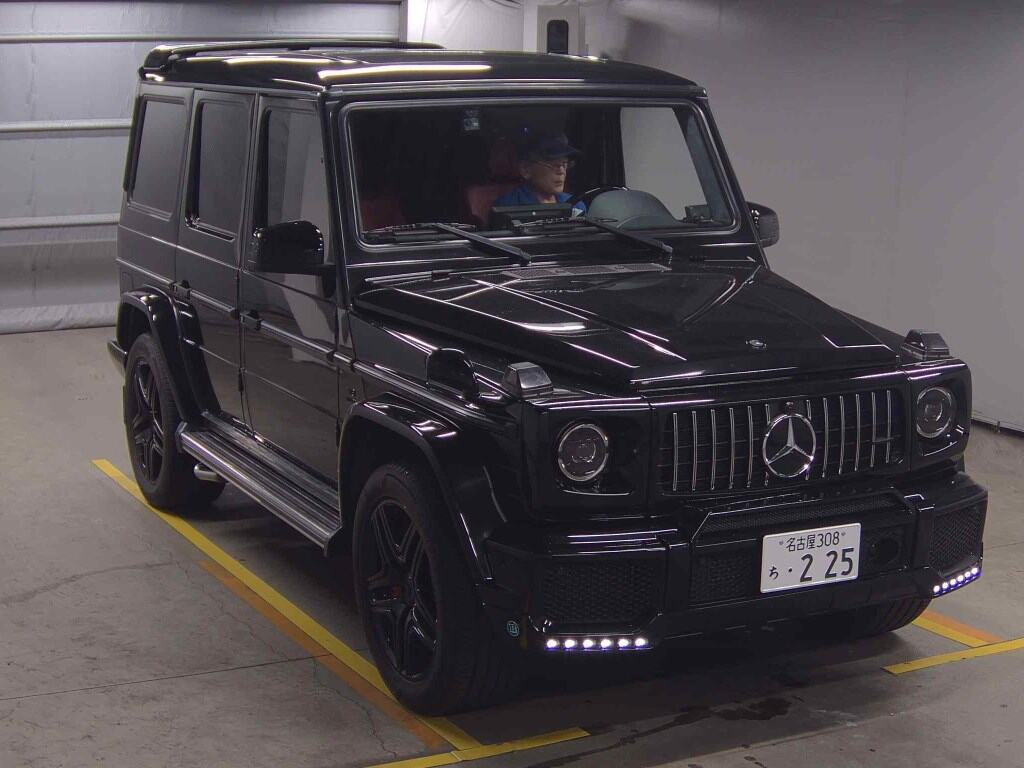
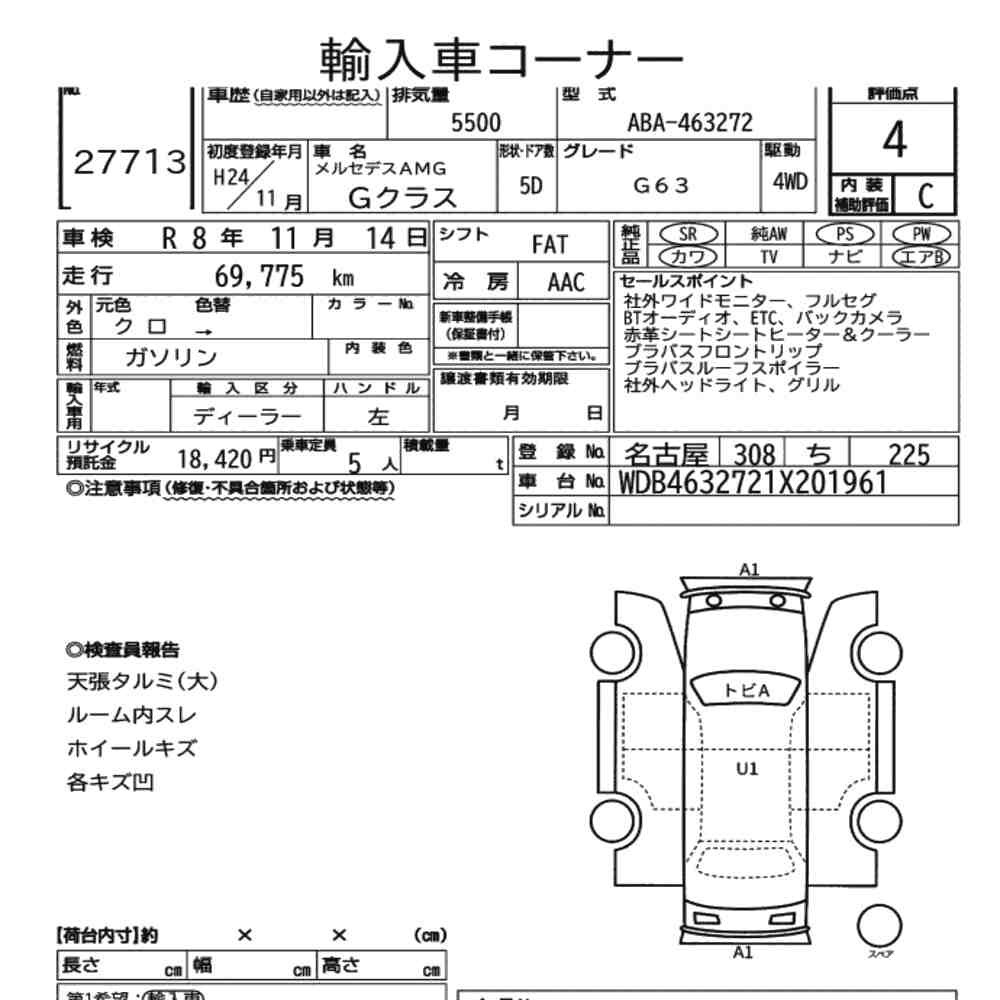
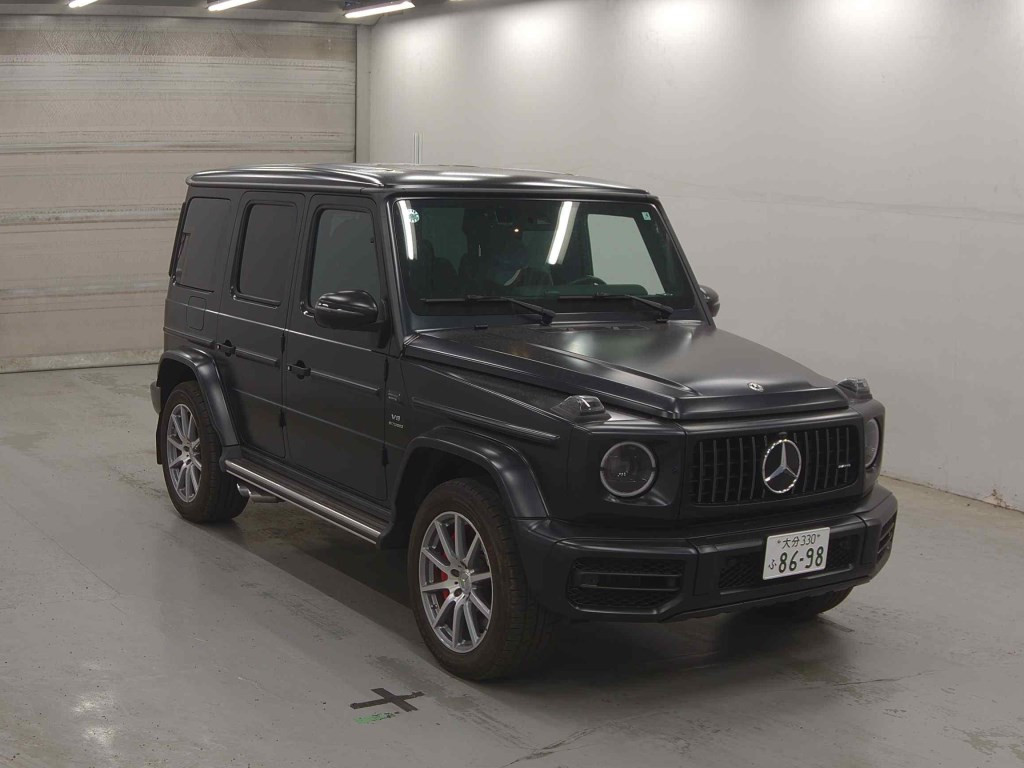
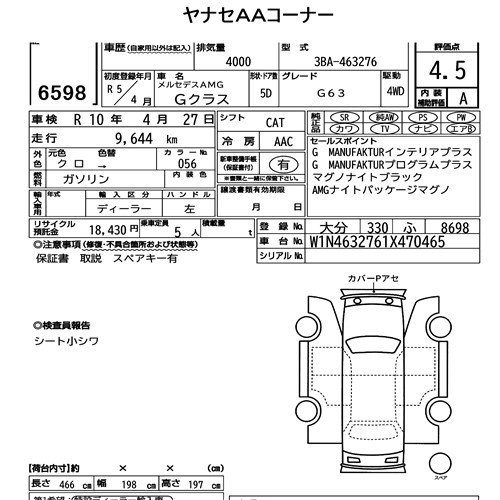
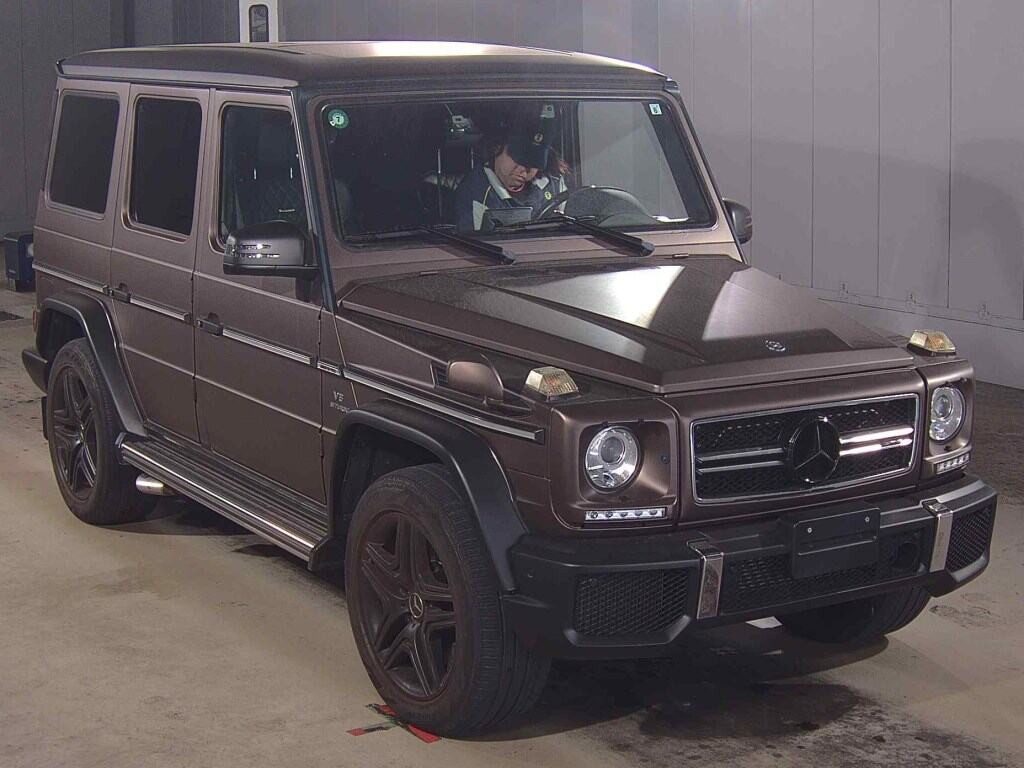
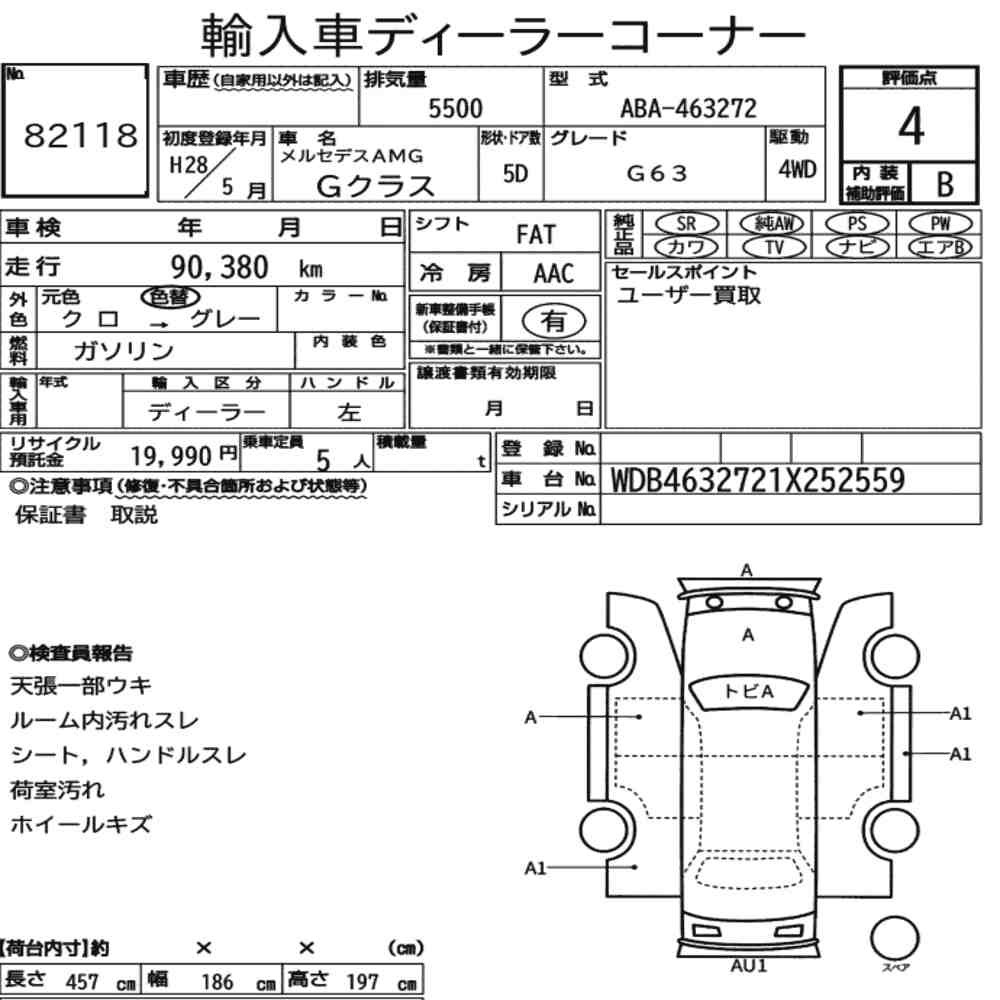
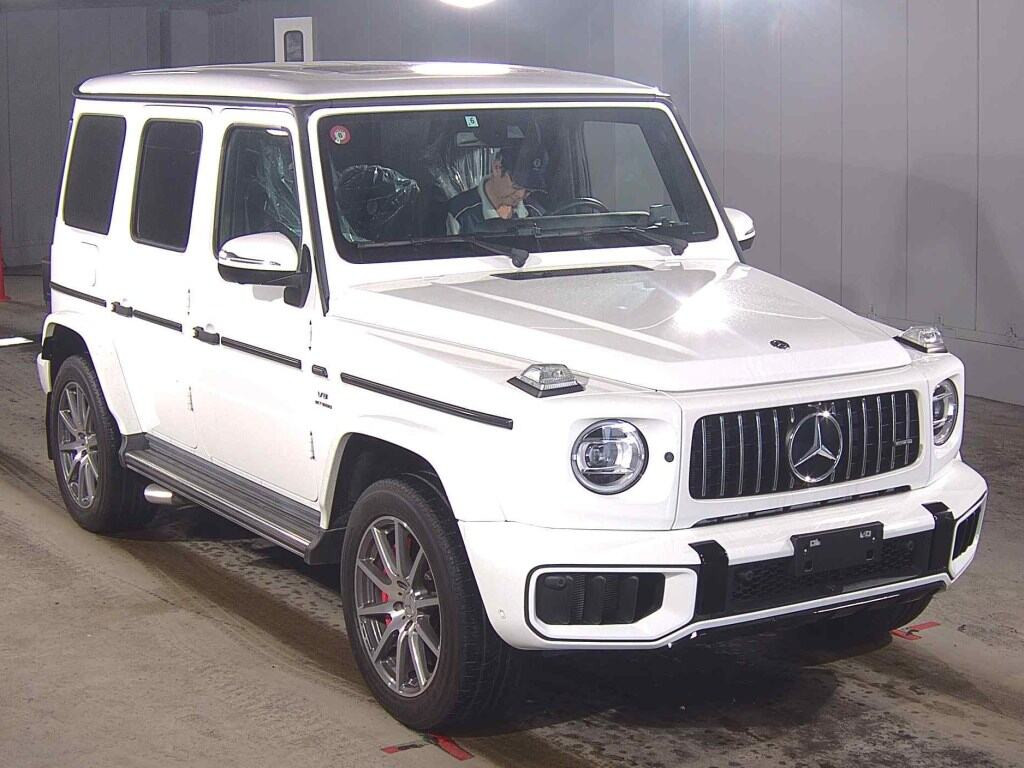
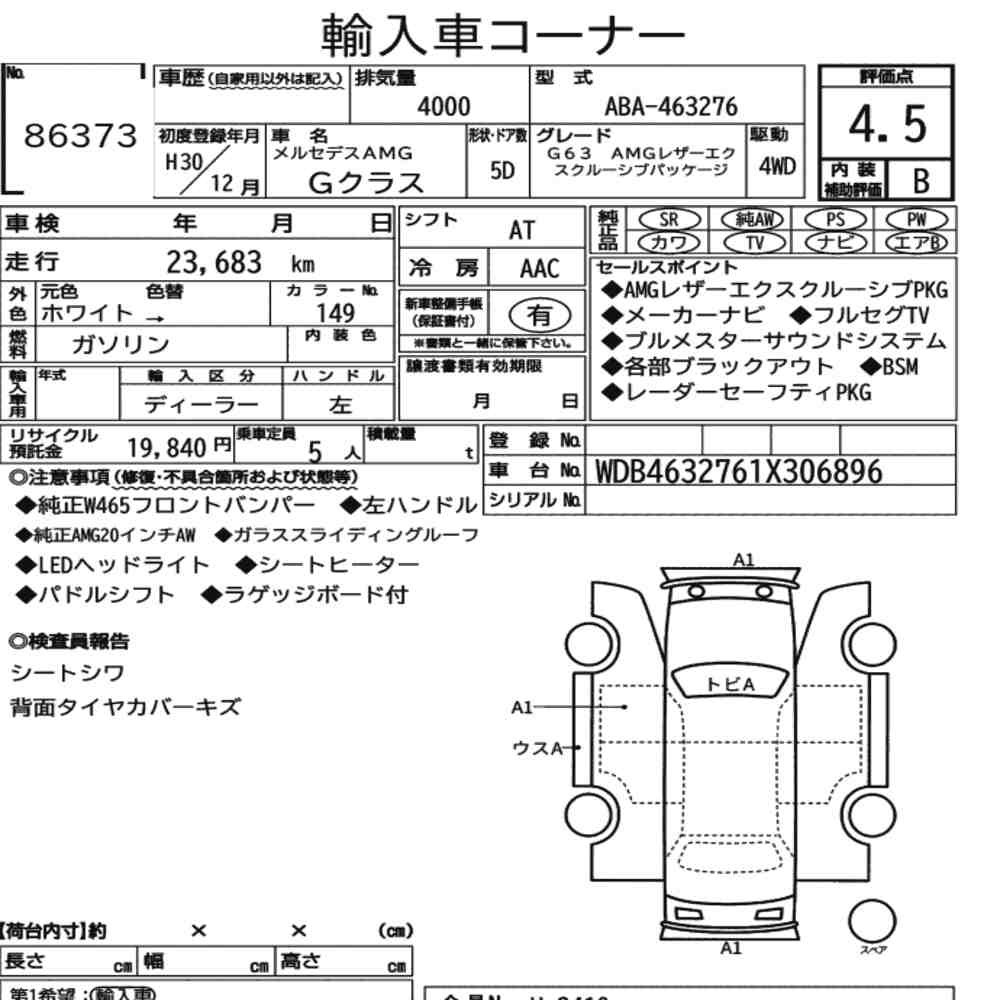
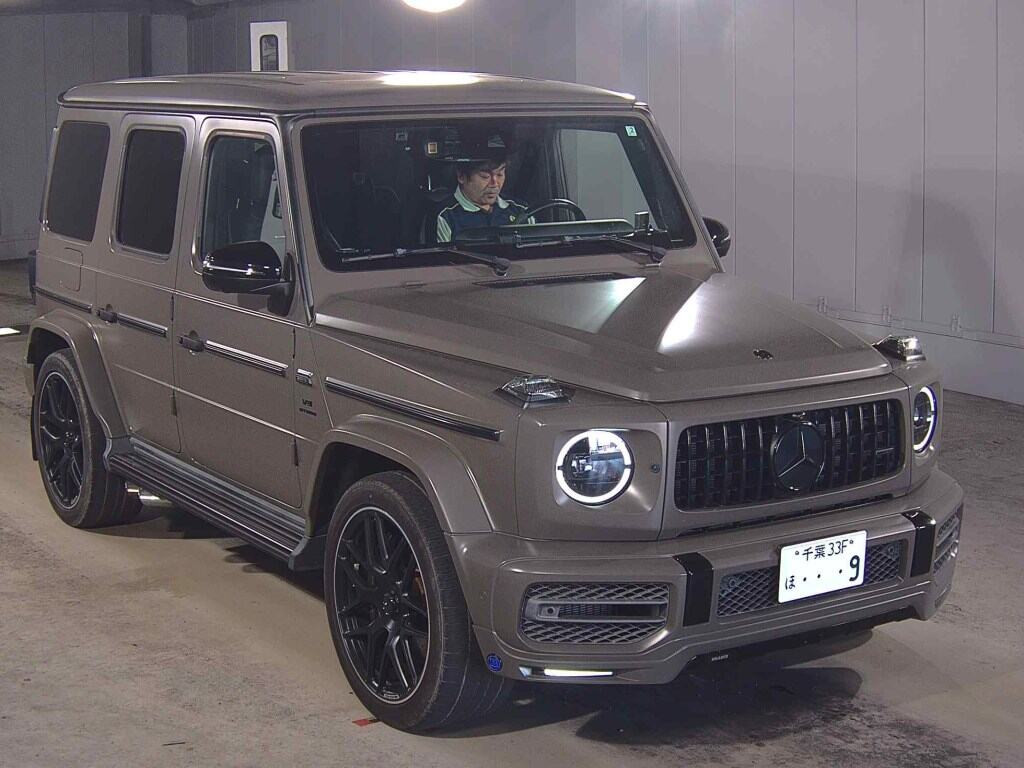
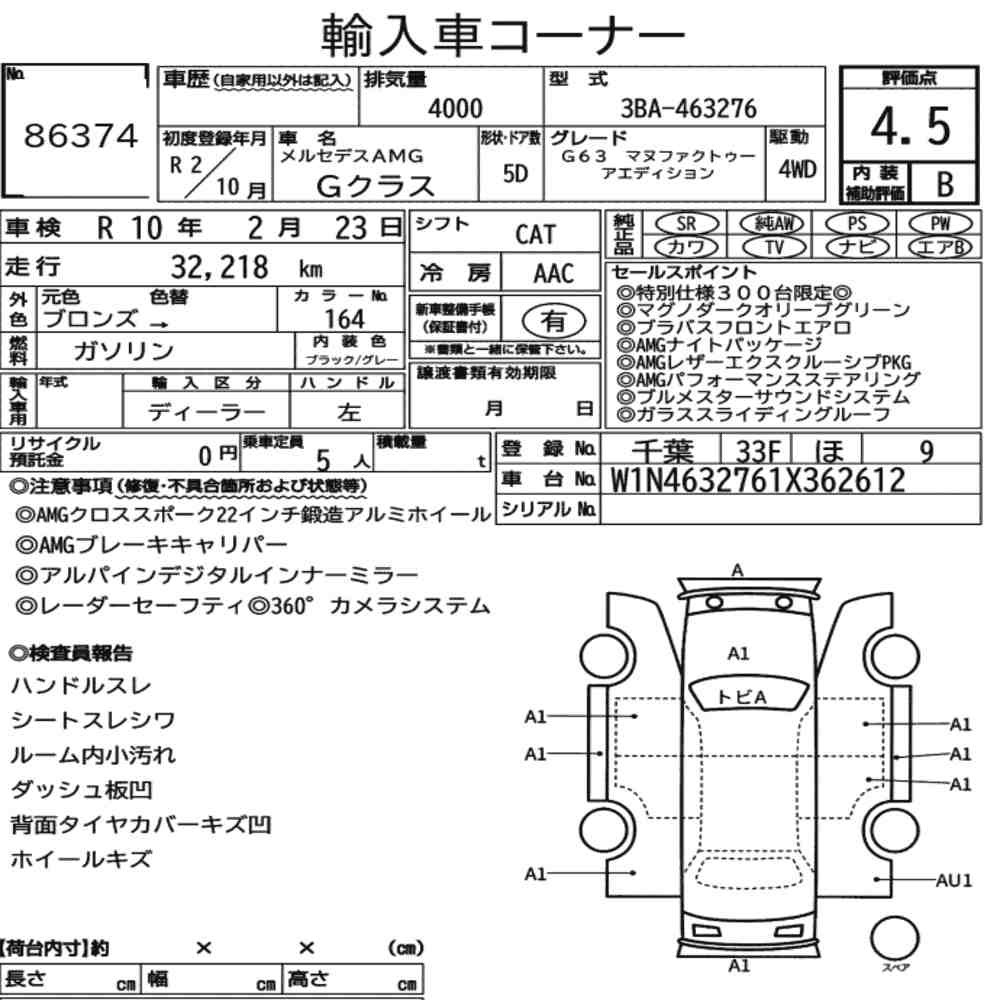
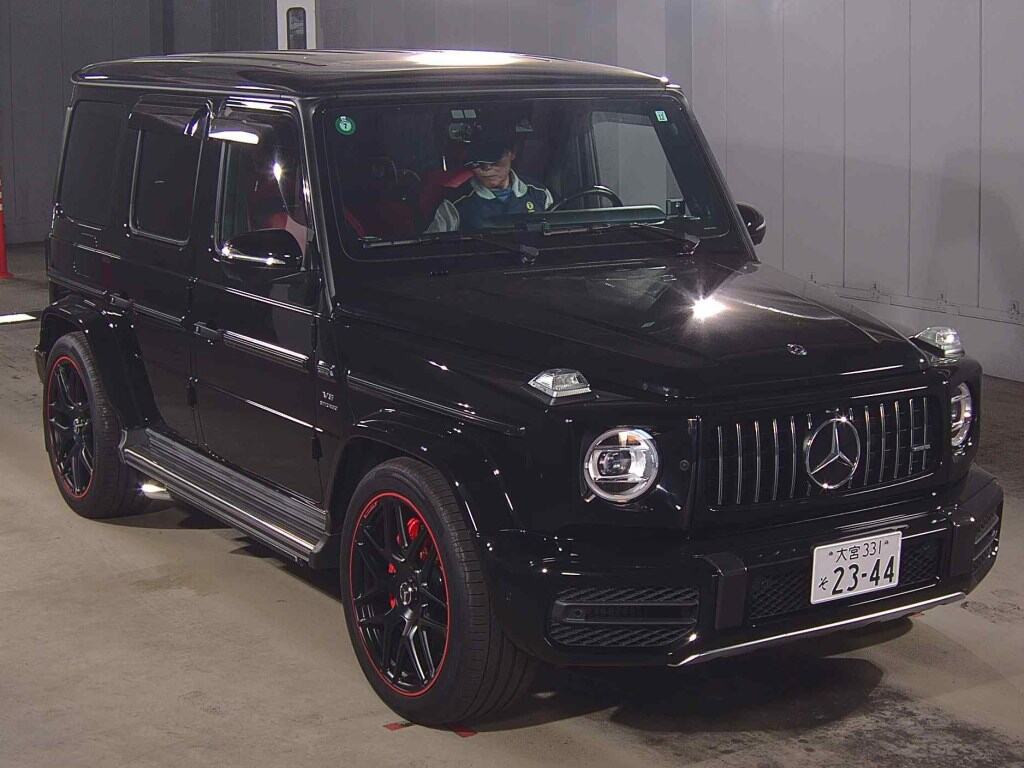
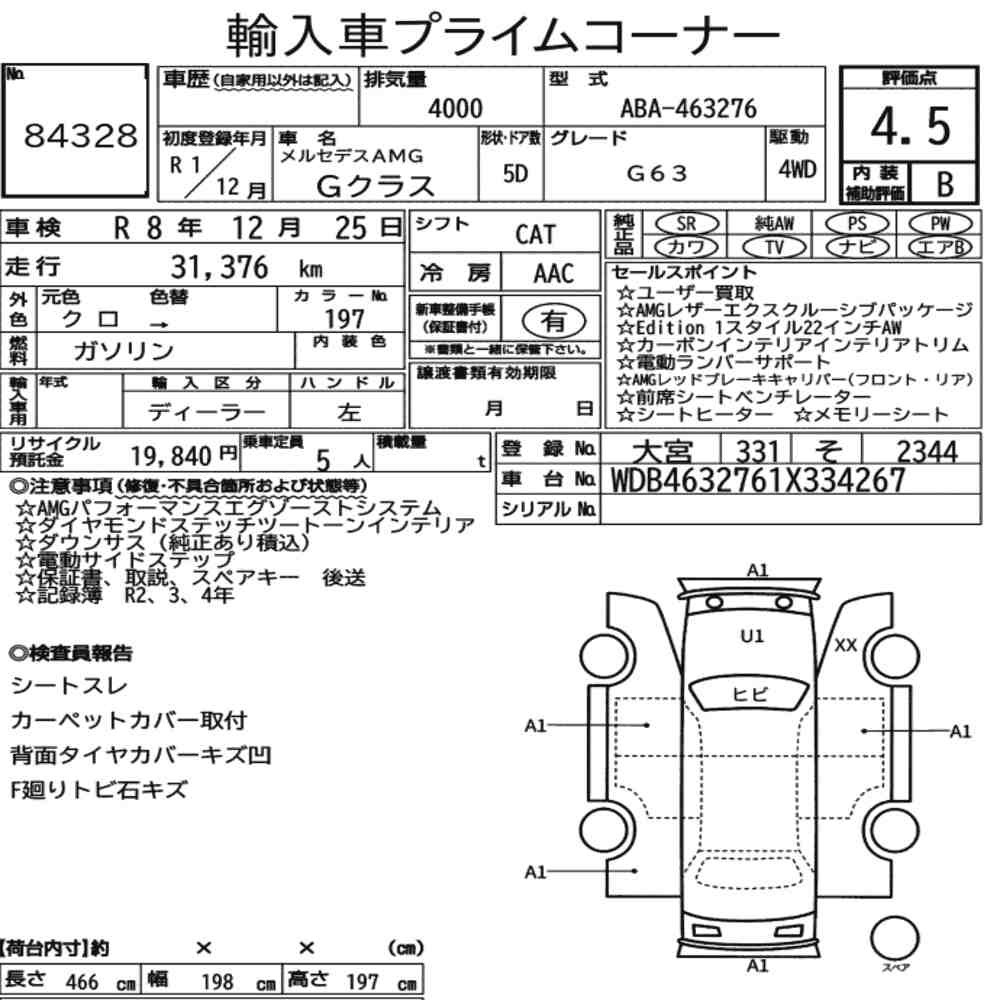
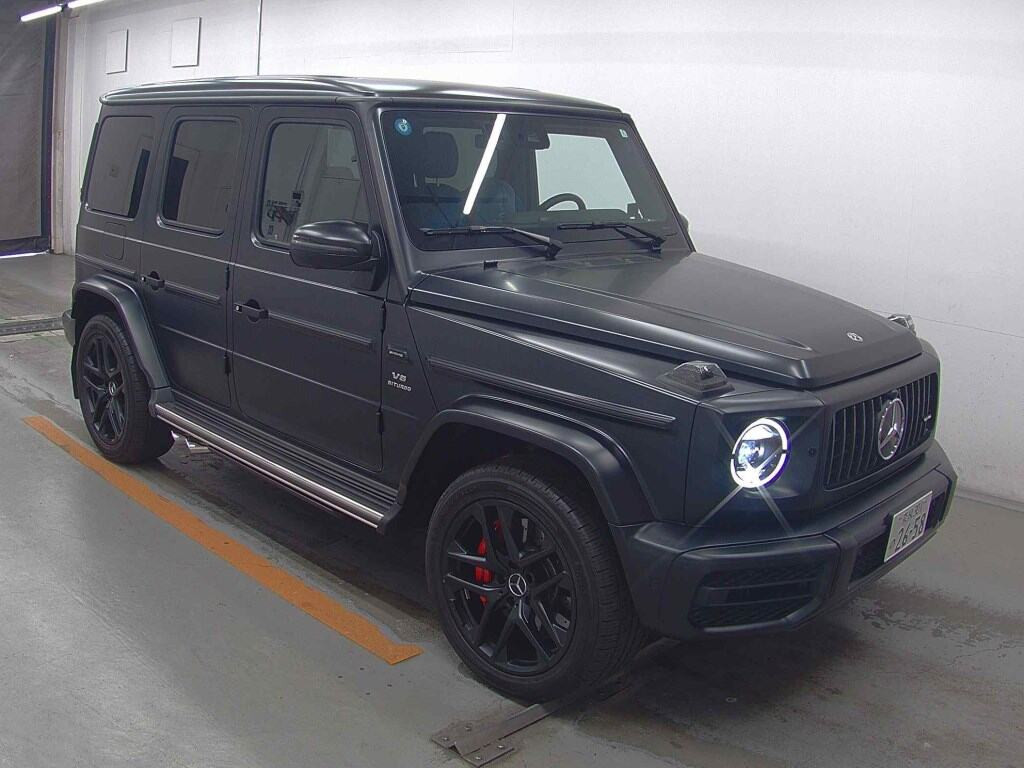
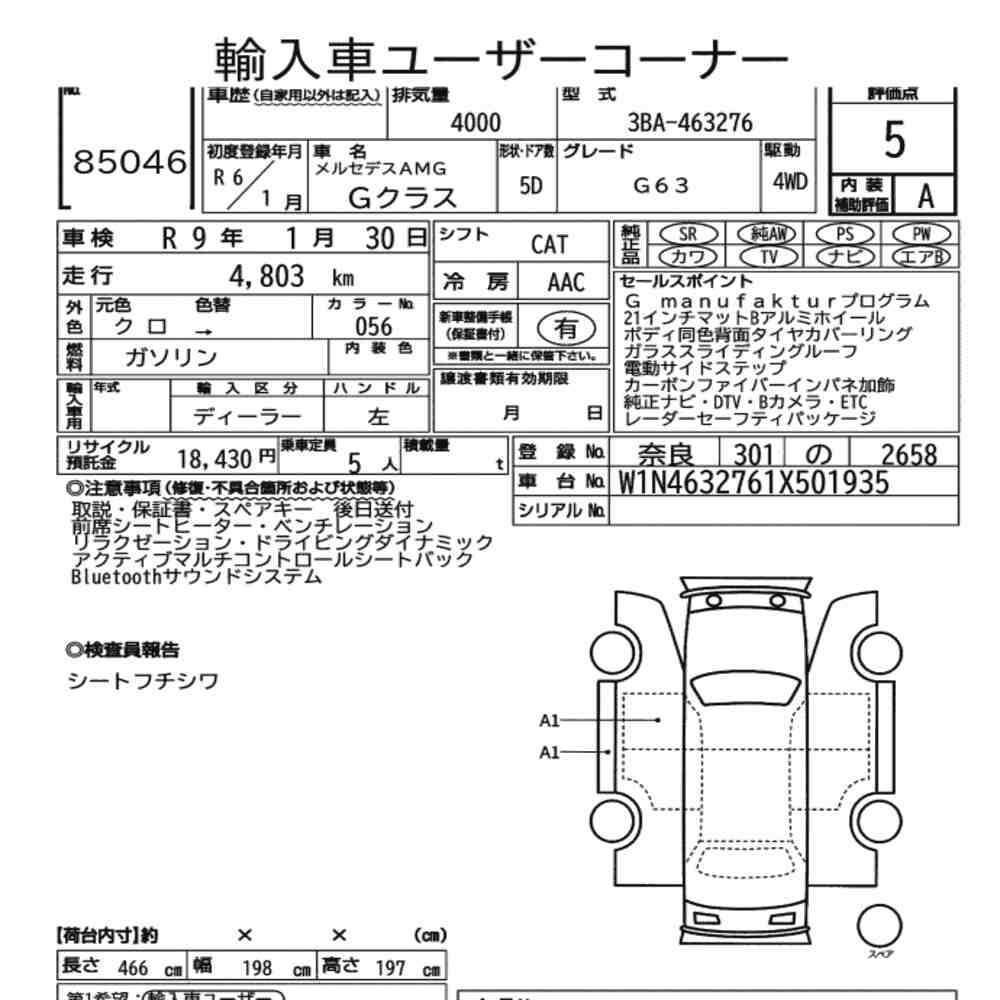
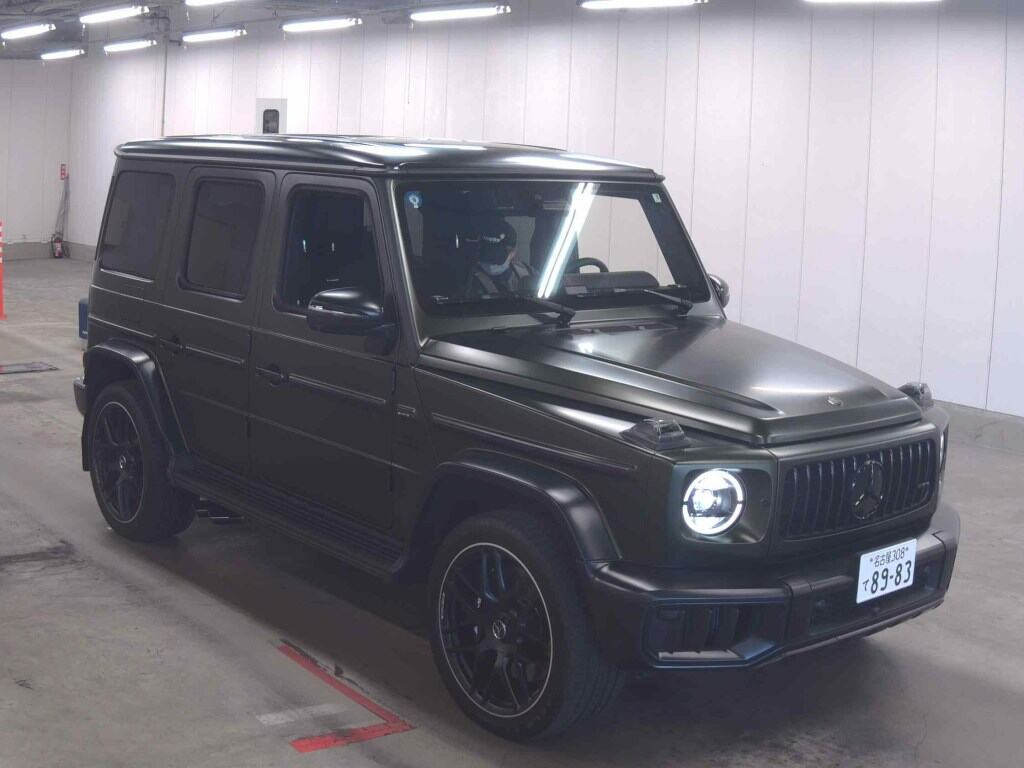
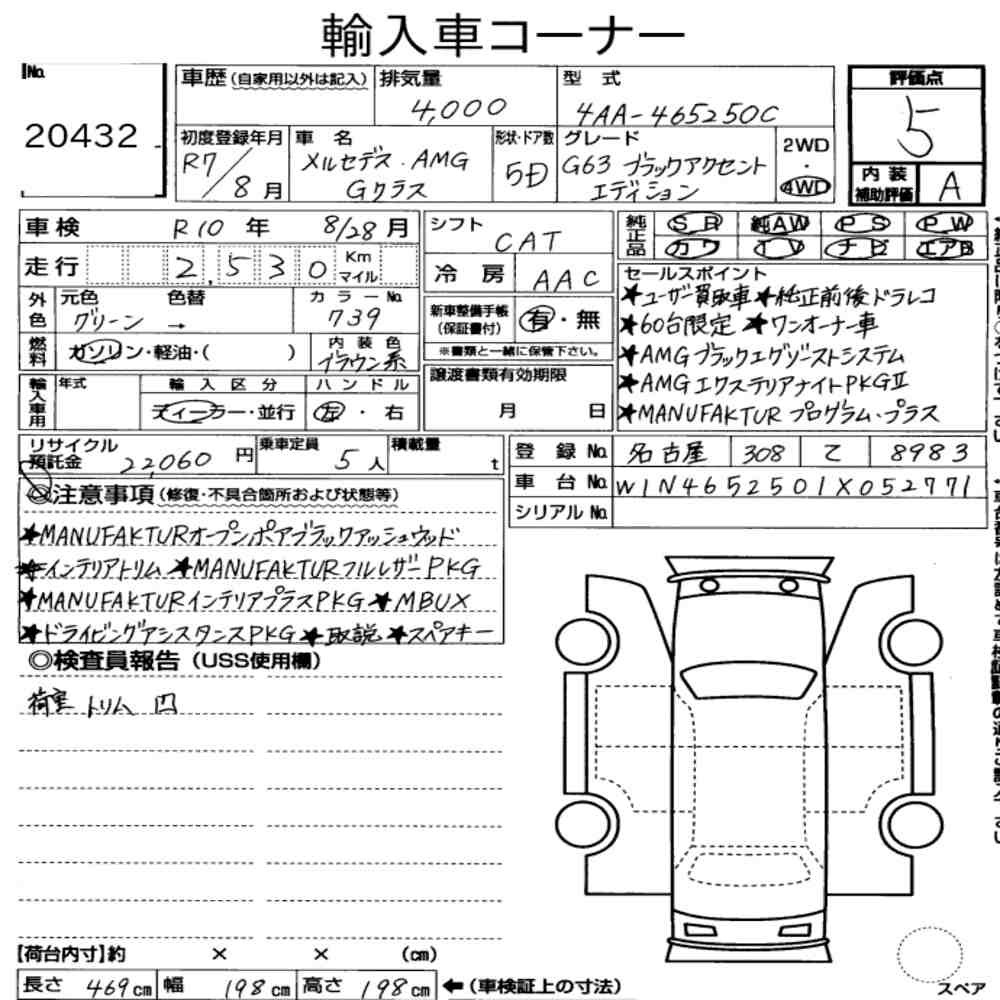
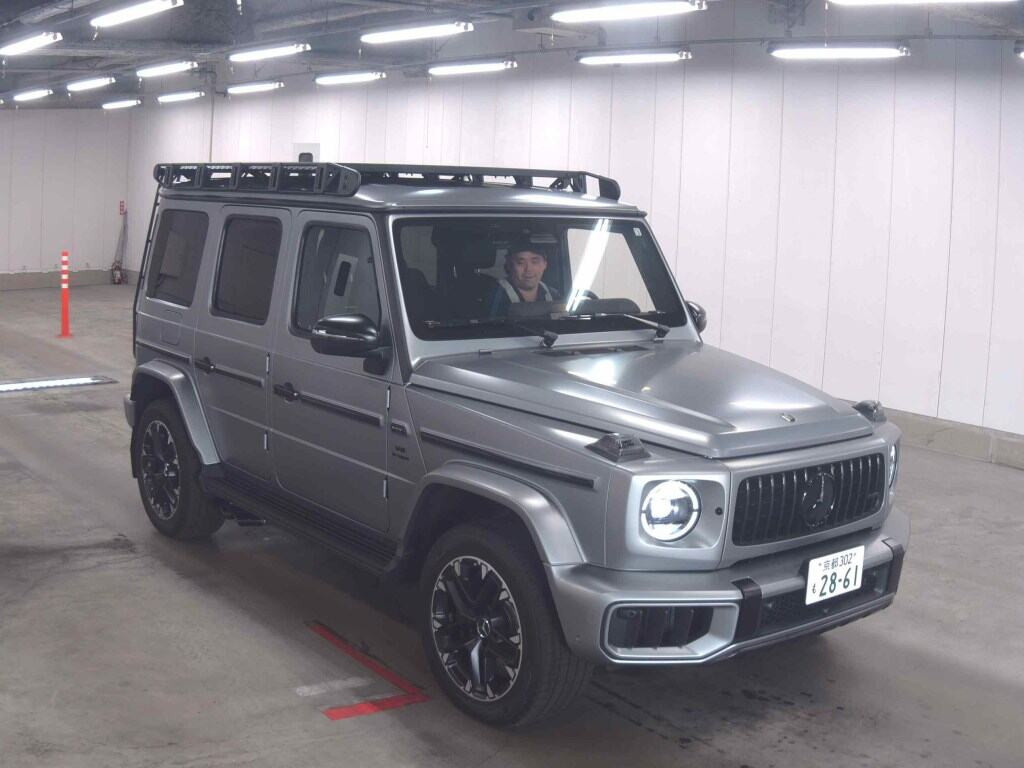
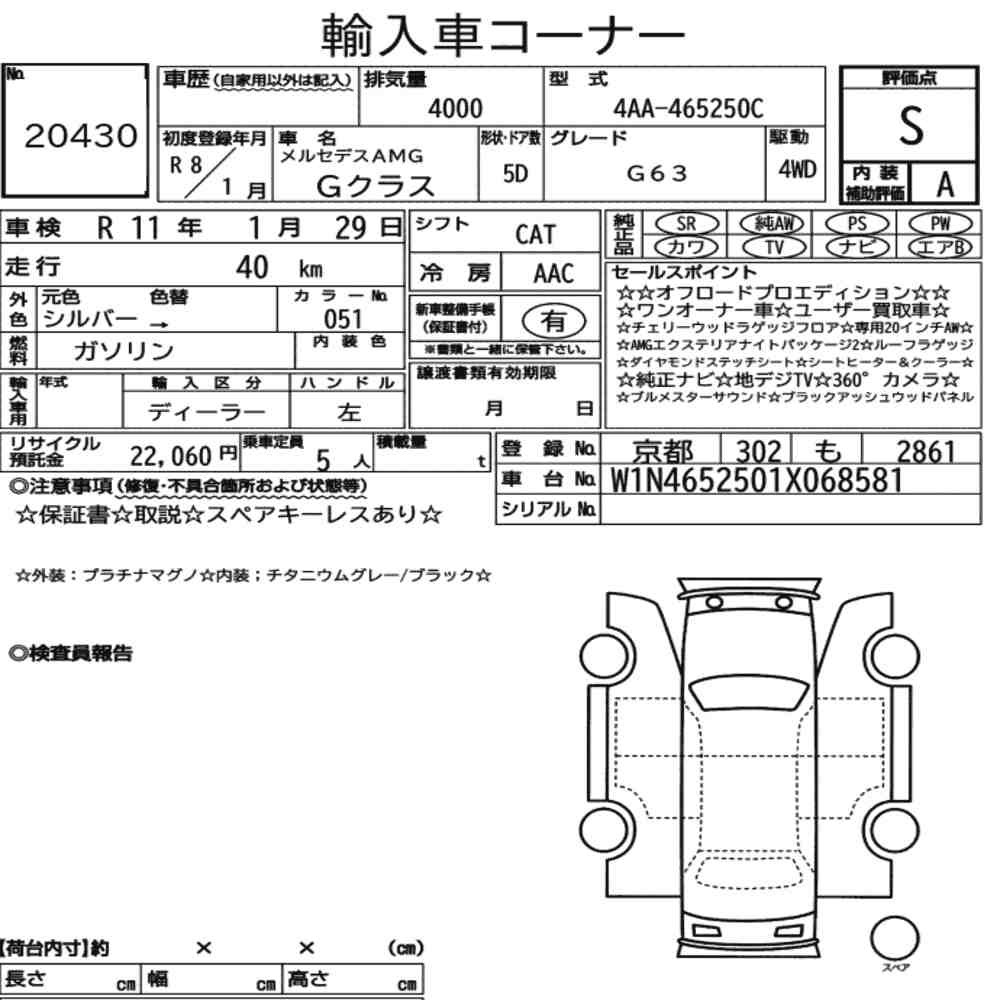
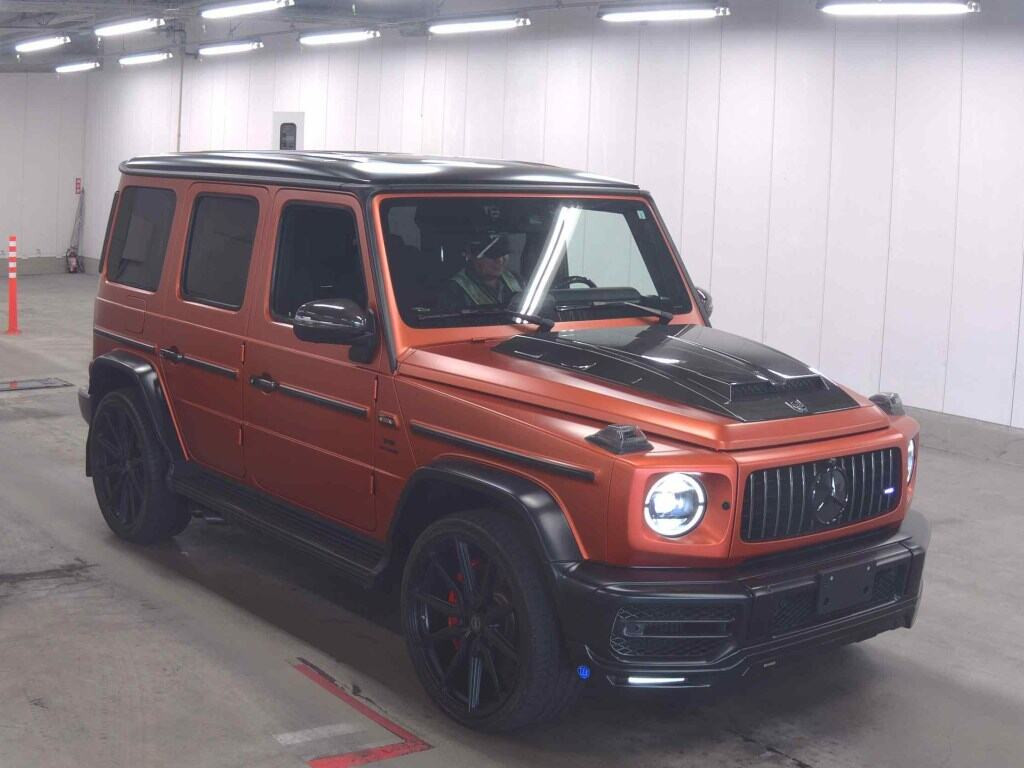
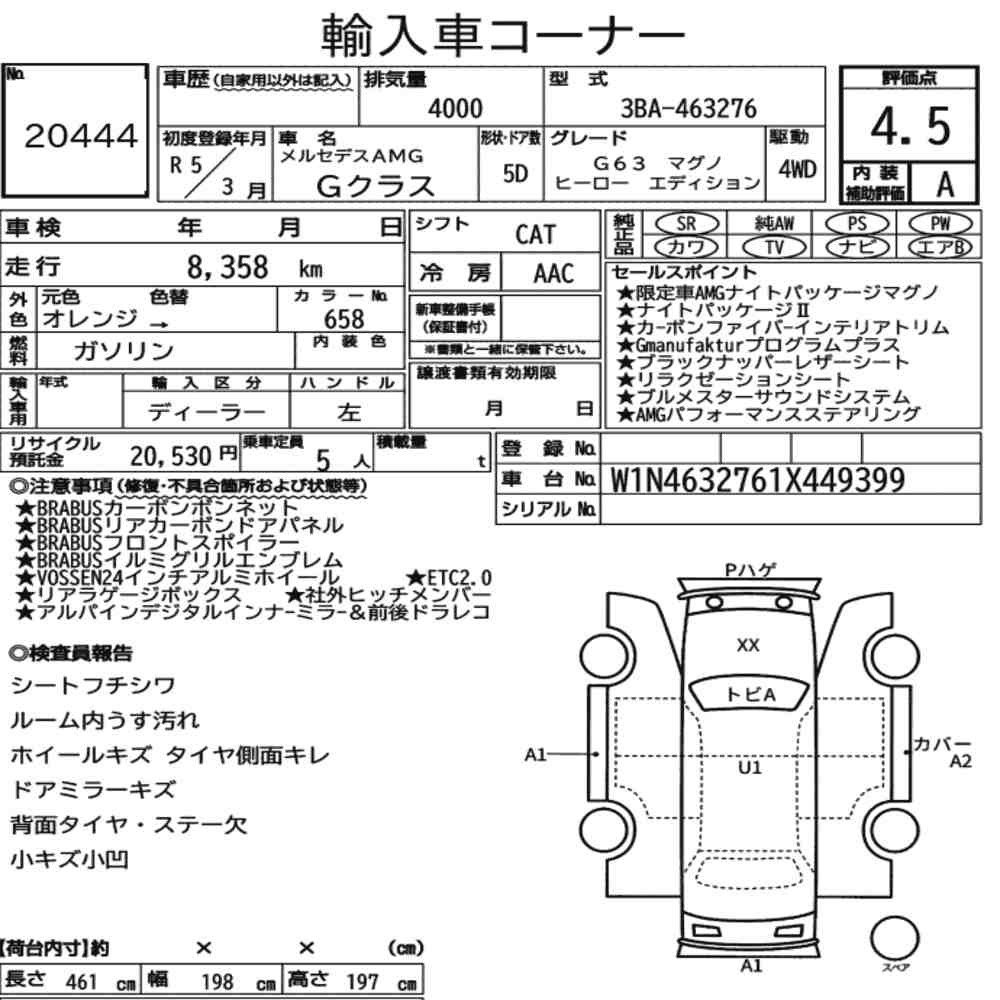
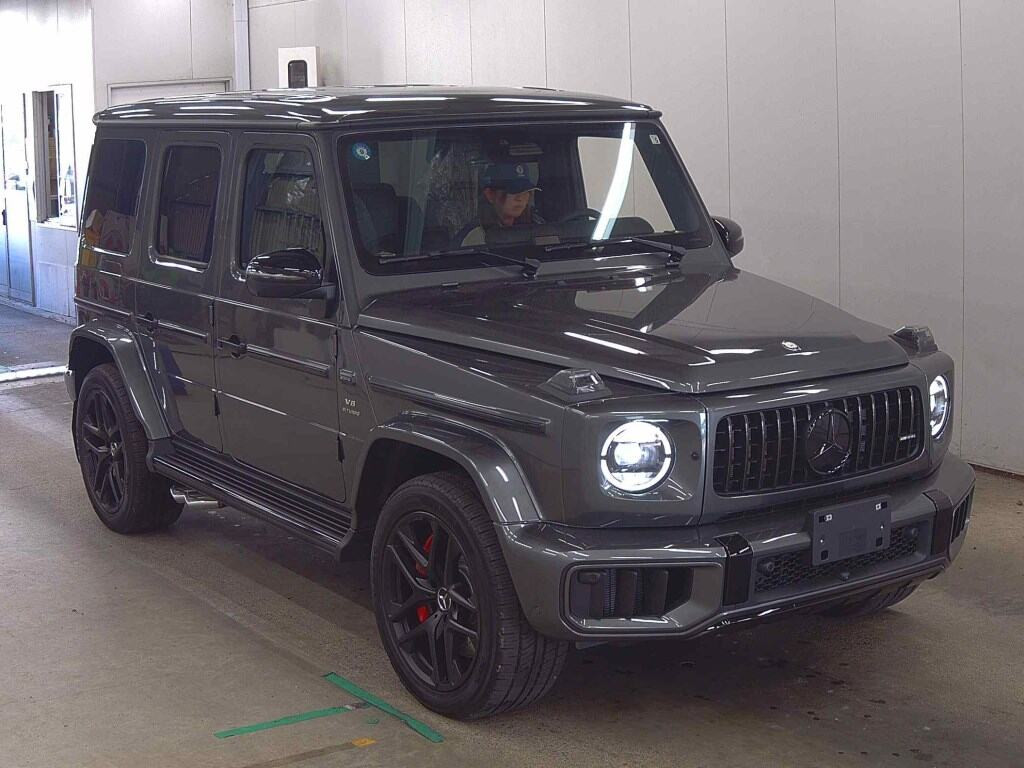
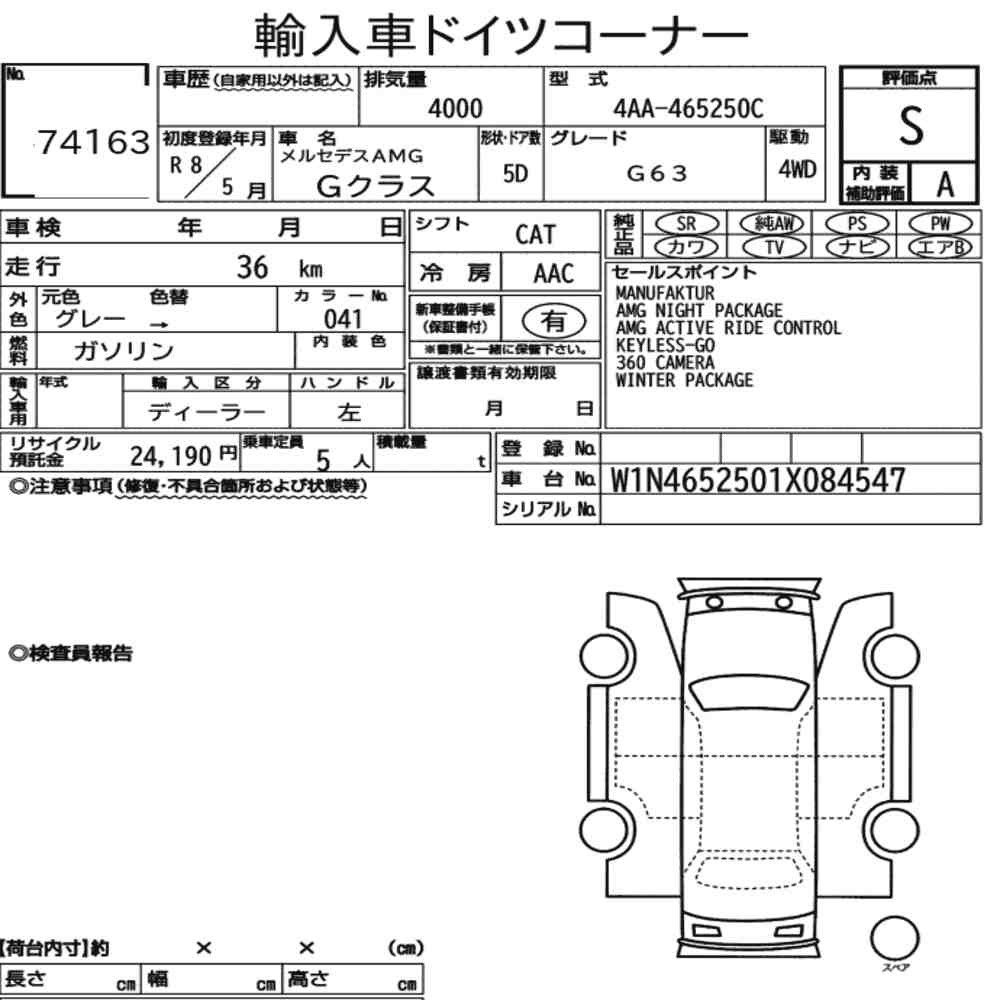
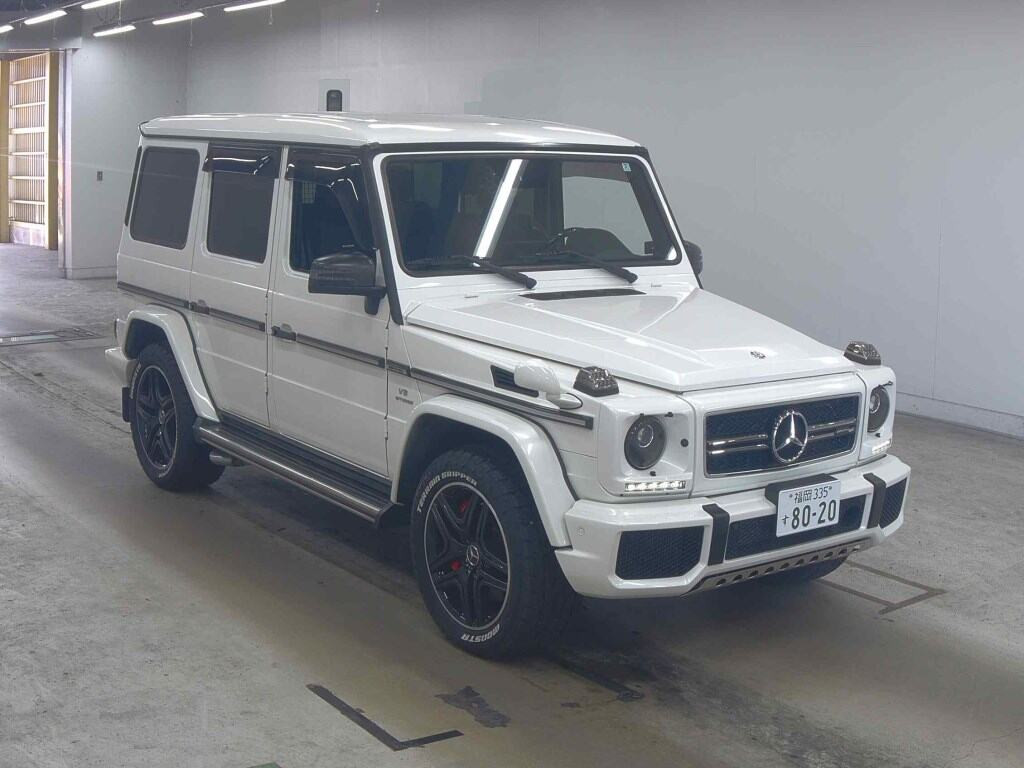
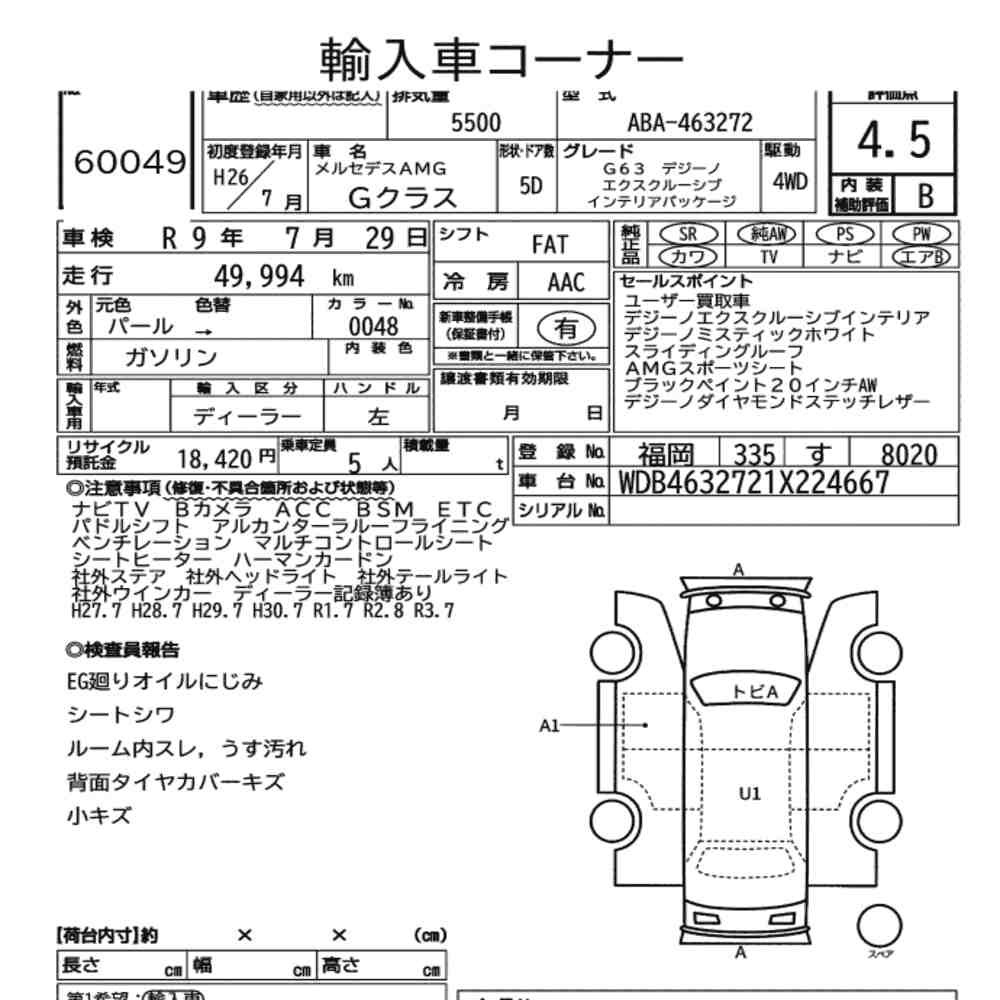
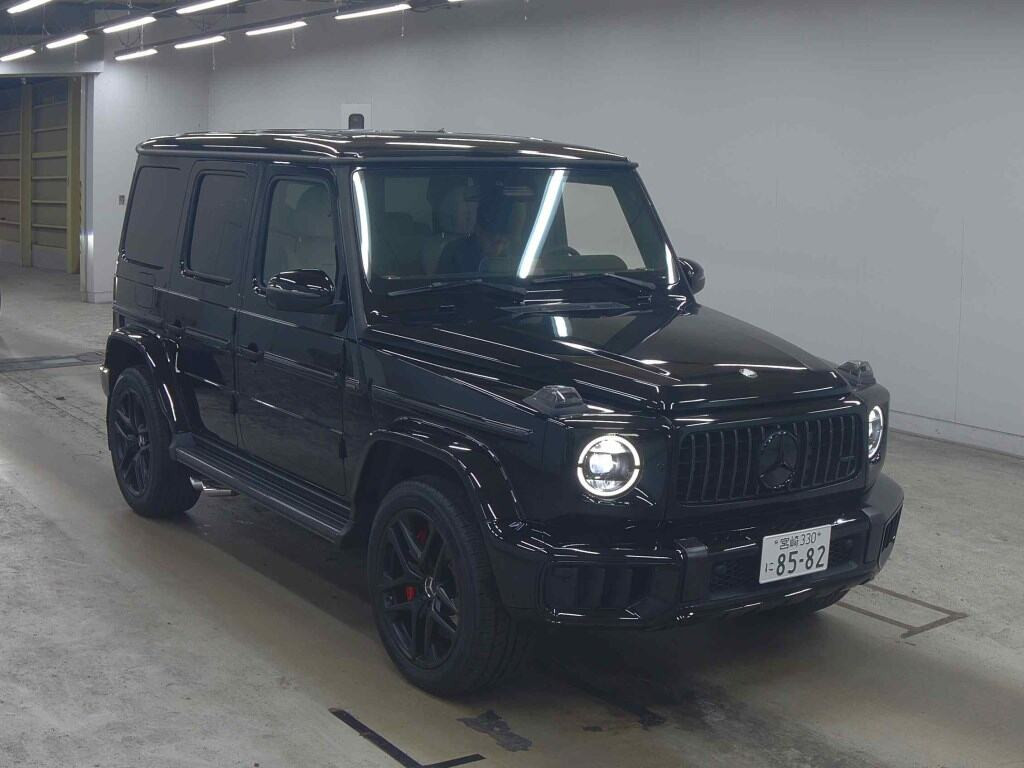
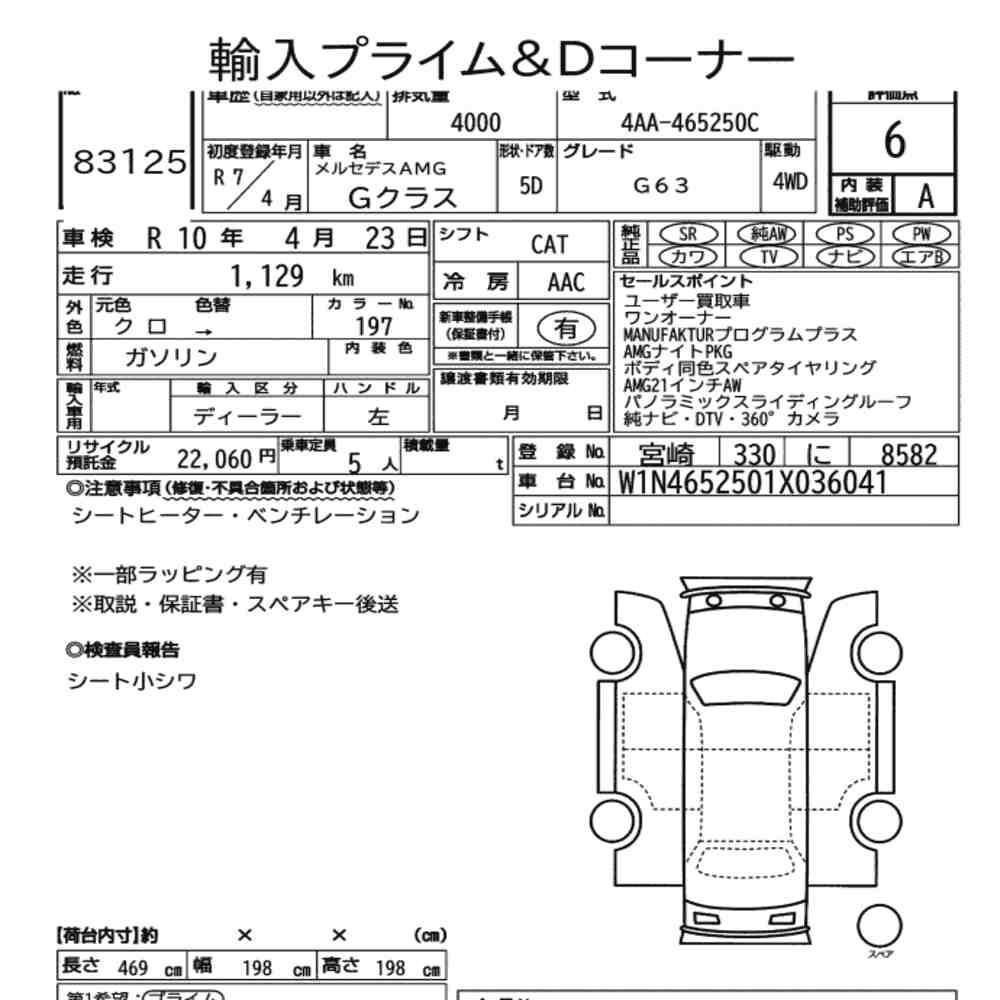
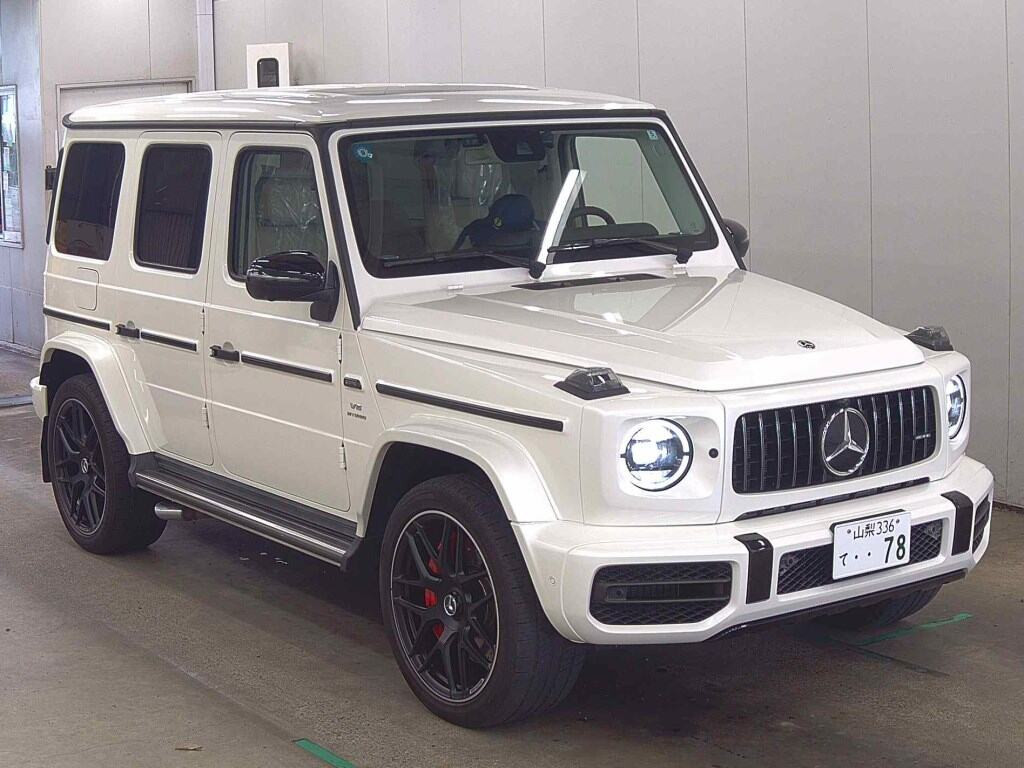
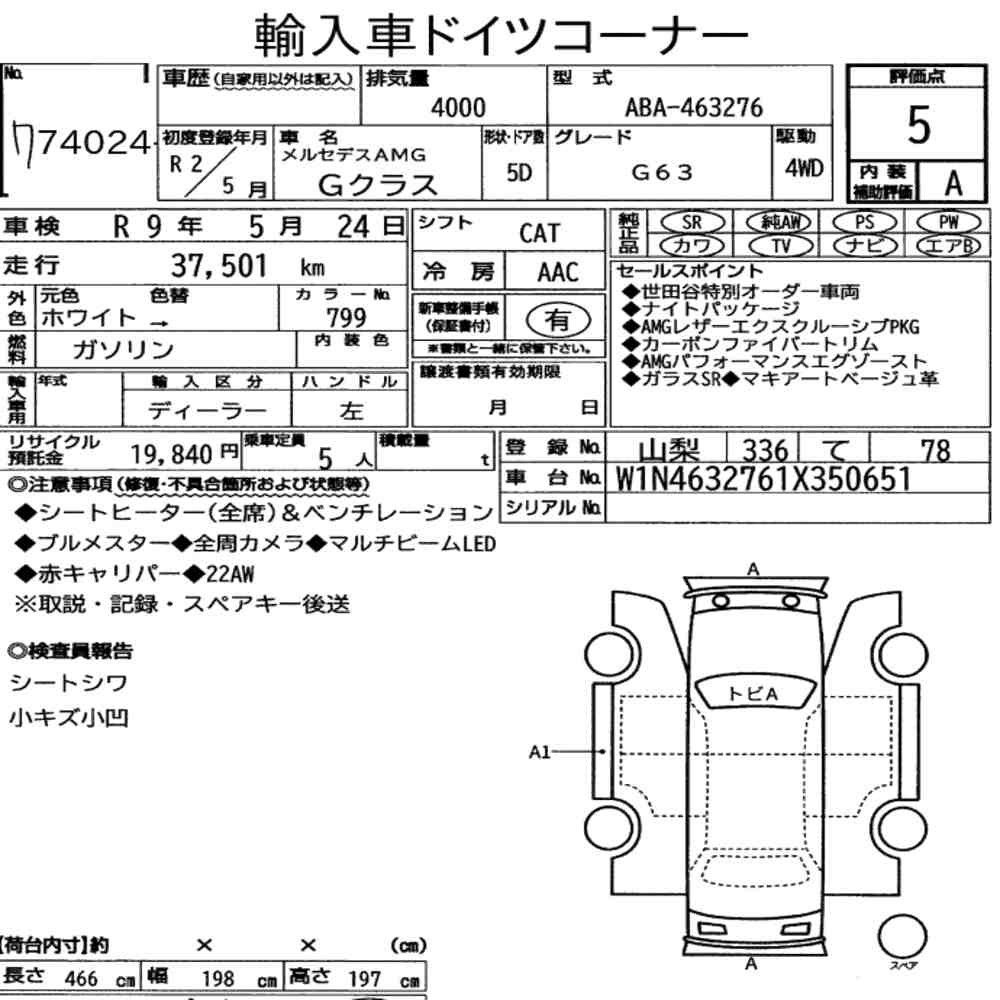
Left-hand drive is the norm here, not the exception: 100% of 740 Mercedes-AMG G-Class lots in our database have the European layout.
189 Mercedes-AMG G-Class lots entered our database in the last 30 days against 164 the month before, so the choice is wider than usual right now.
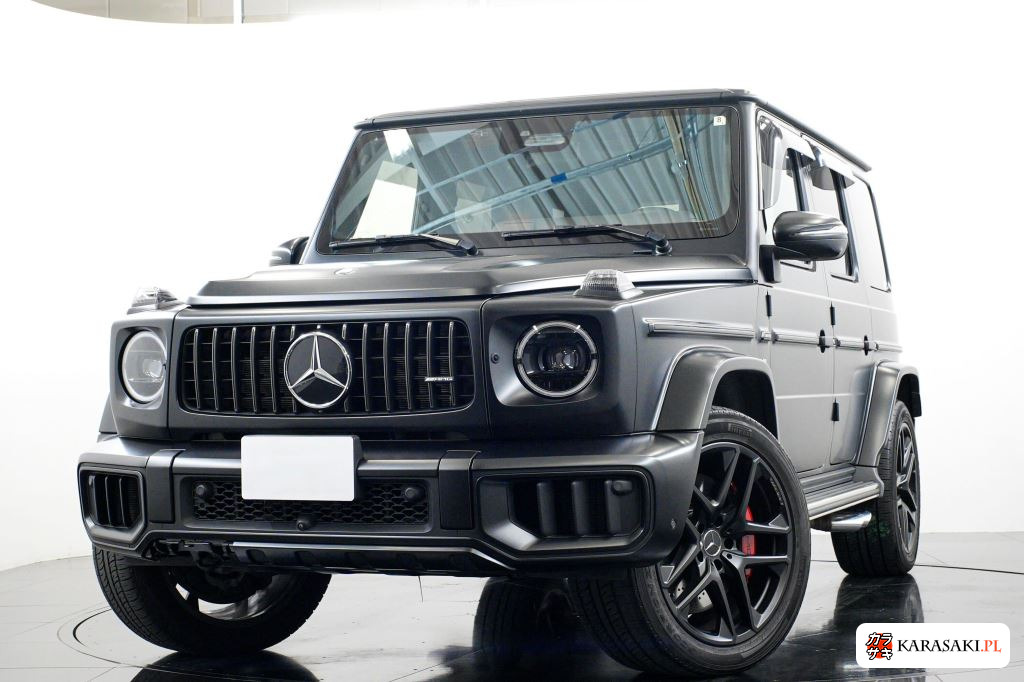
Mercedes-AMG G-Class supply spreads across many years: the three most common model years (2018, 2021 and 2025) make up 32% of 740 lots with a known model year; the rest are other generations.
Across 692 priced Mercedes-AMG G-Class auctions the median starting price is 14M JPY. The refundable pre-bid deposit is 10% of the starting price, so work it out before choosing a car at this level.