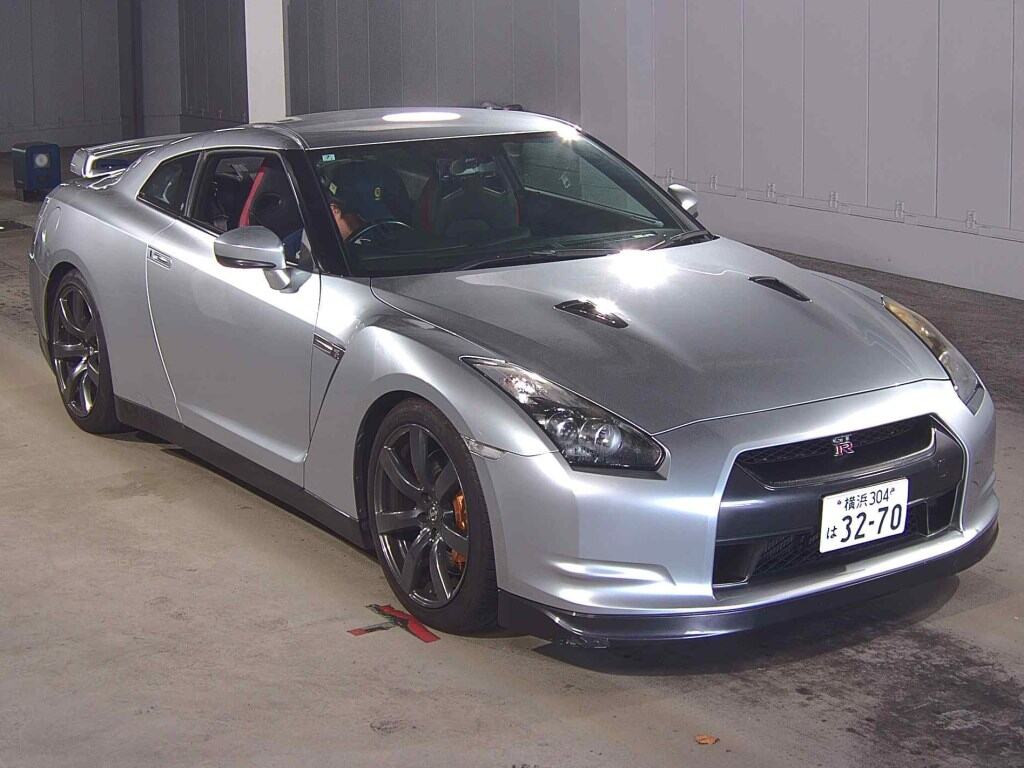
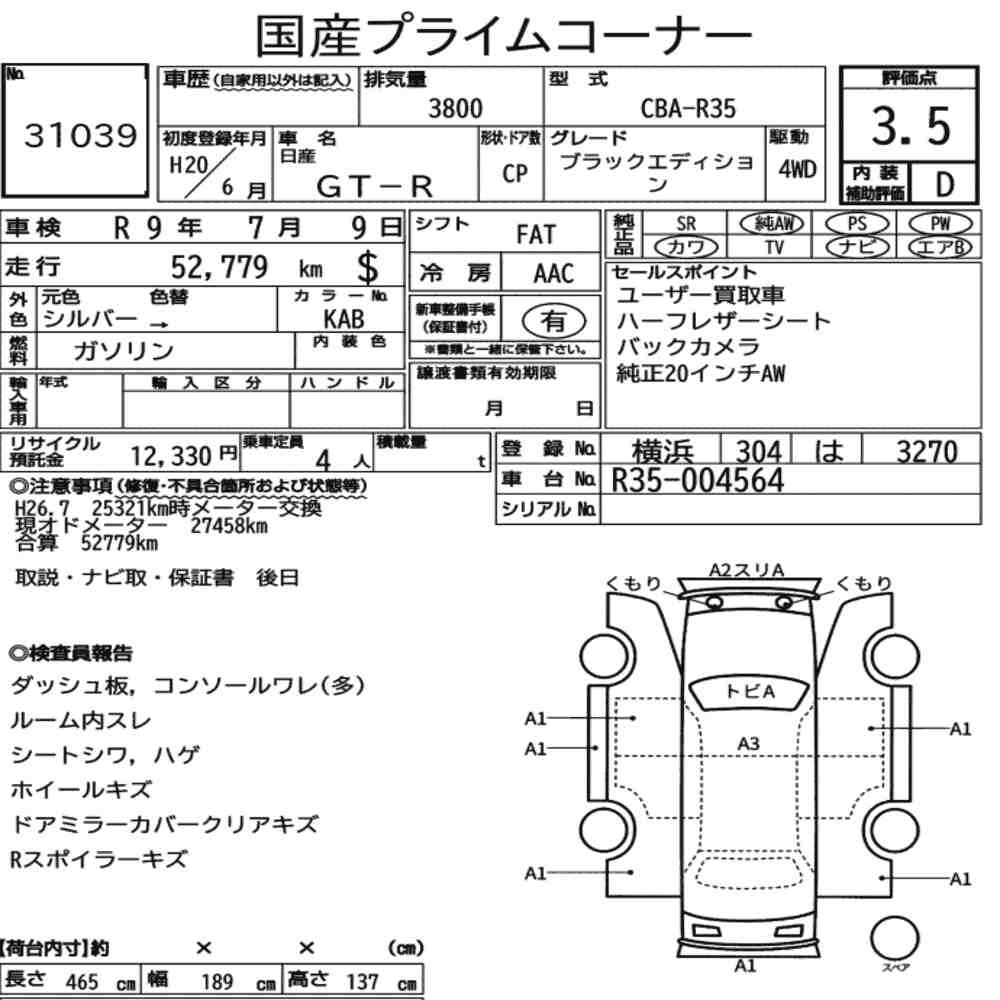
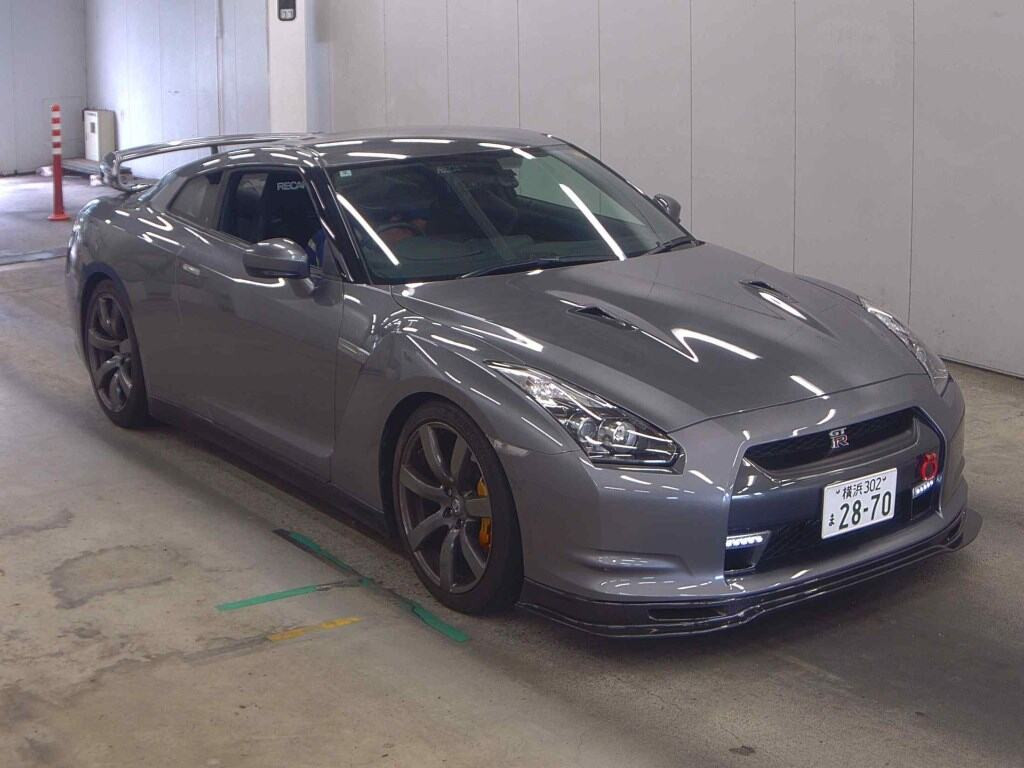
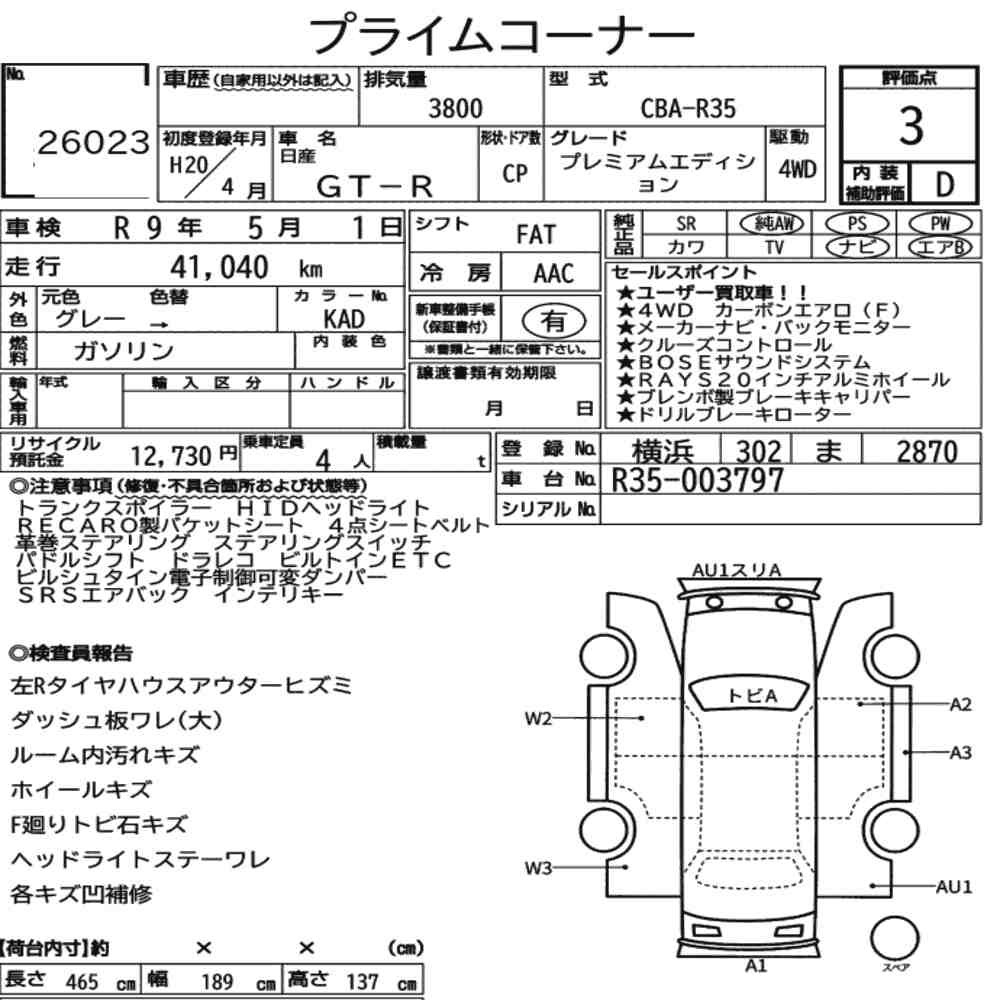
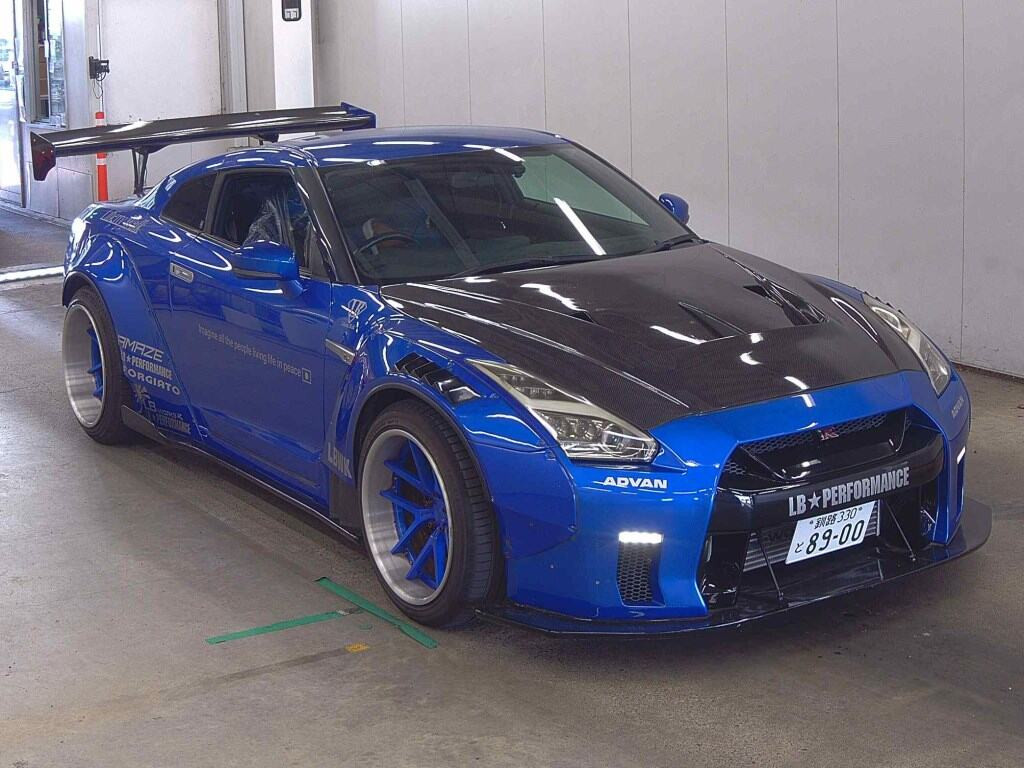
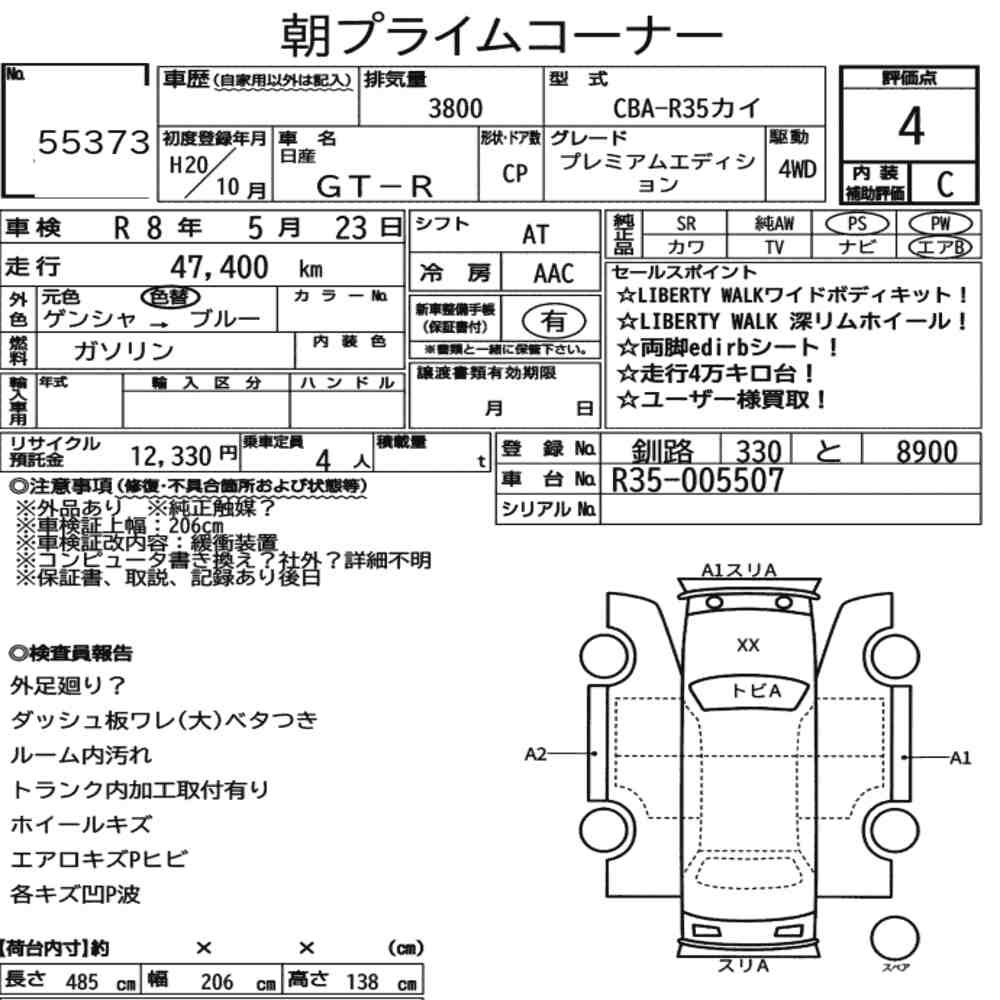
Model years 2007 to 2010: 81 listings
The first R35s, with 480 PS at launch. Until November 2010 Japanese catalogues list them under the type designation CBA-R35. These 81 listings cover about 53 different cars, out of the 431 R35 listings collected since June 2026 (as of 21 September 2026), with a median mileage of 54,000 km. The year on an auction sheet is the year of first registration in Japan, so a car from the end of a model year is sometimes recorded under the following year.
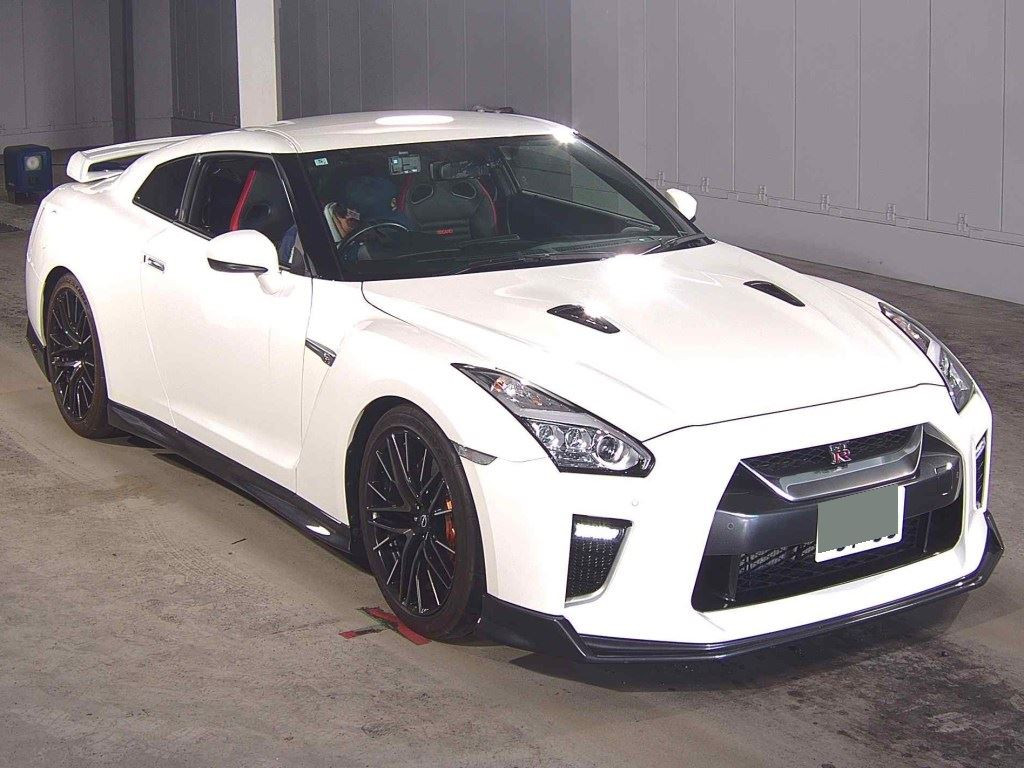
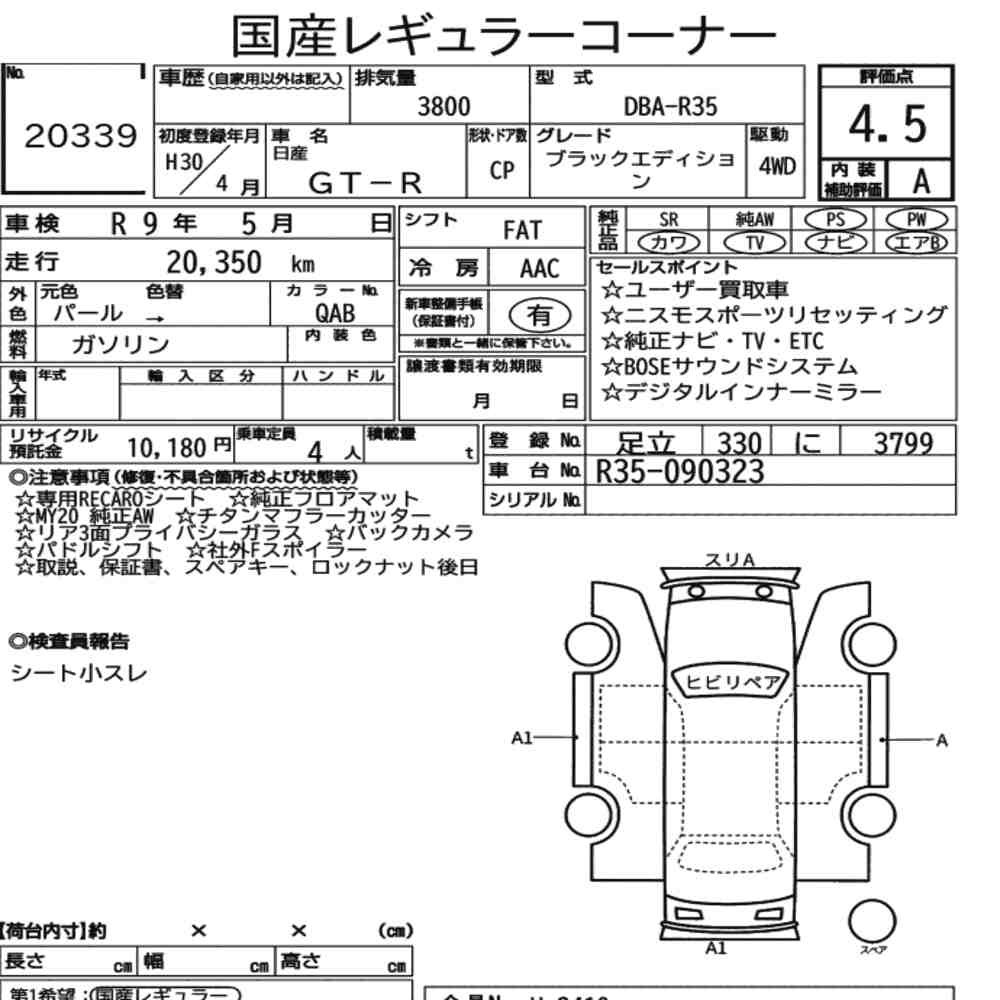
Model years 2011 to 2016: 56 listings
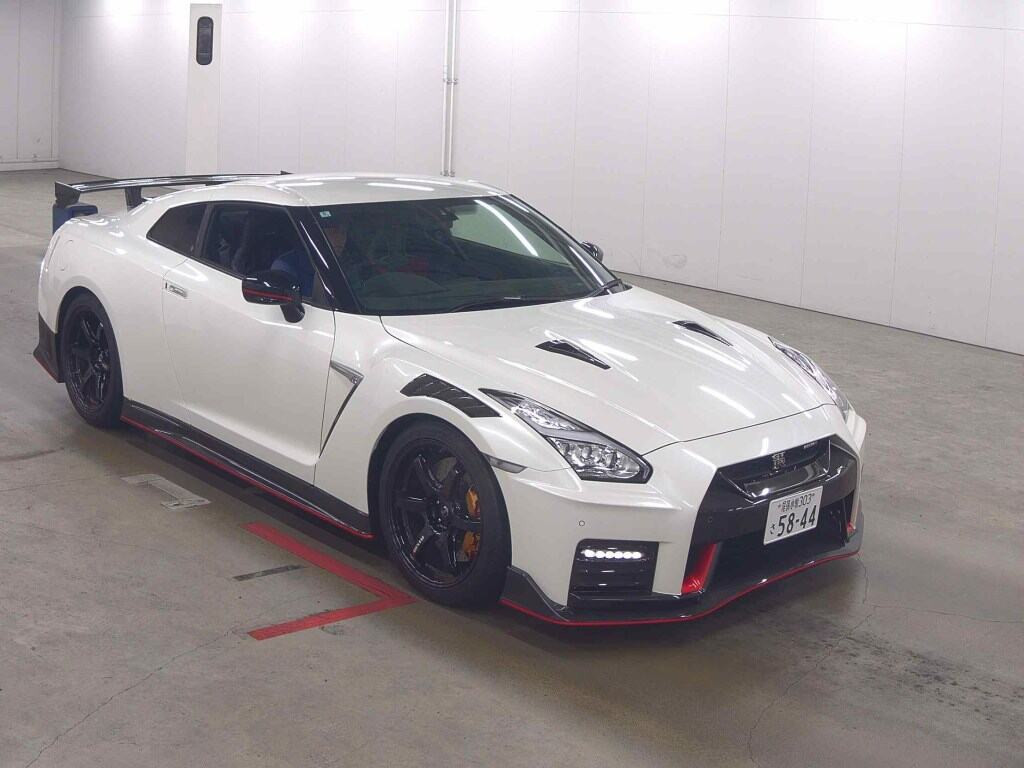
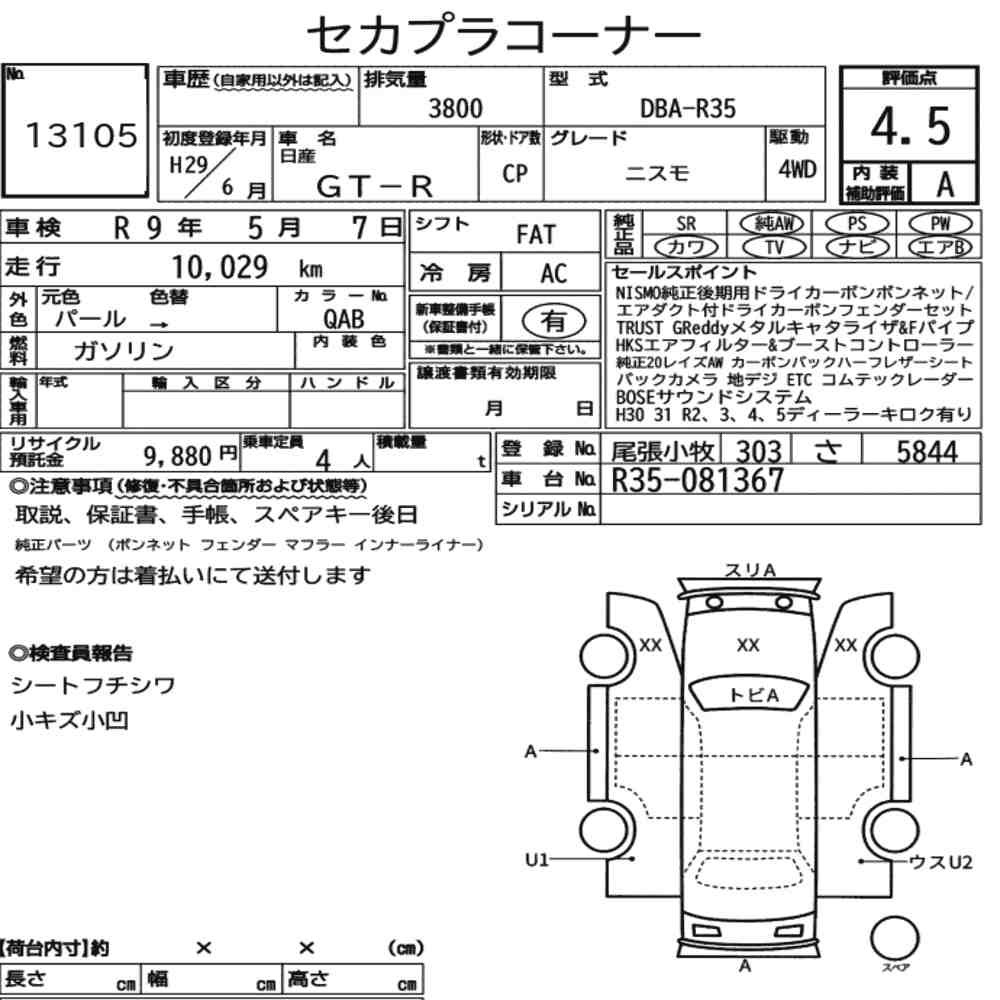
From November 2010 to January 2019 Japanese catalogues show the type designation DBA-R35. According to Nissan the 2011 model, on sale from 17 November 2010, makes 530 PS, and the 2012 model, on sale from 24 November 2011, makes 550 PS. The 600 PS GT-R Nismo joined the Japanese range in February 2014. The catalogue holds about 41 cars, the smallest of the four groups, with a median mileage of 36,500 km (as of 21 September 2026).
Model years 2017 to 2022: 86 listings
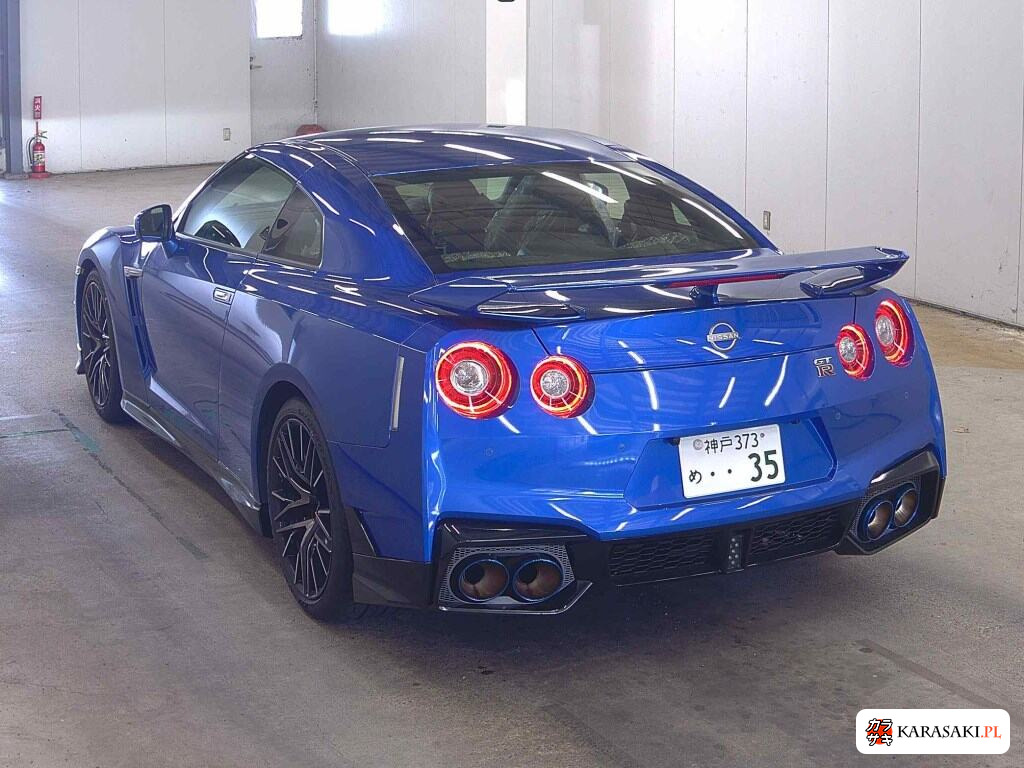
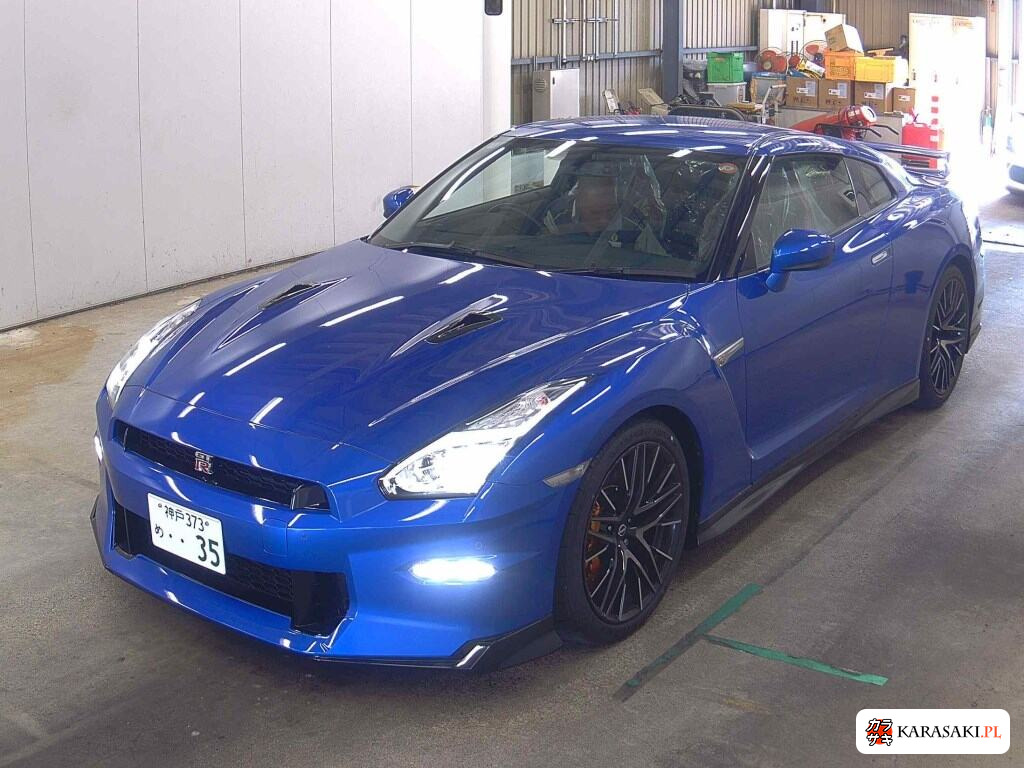
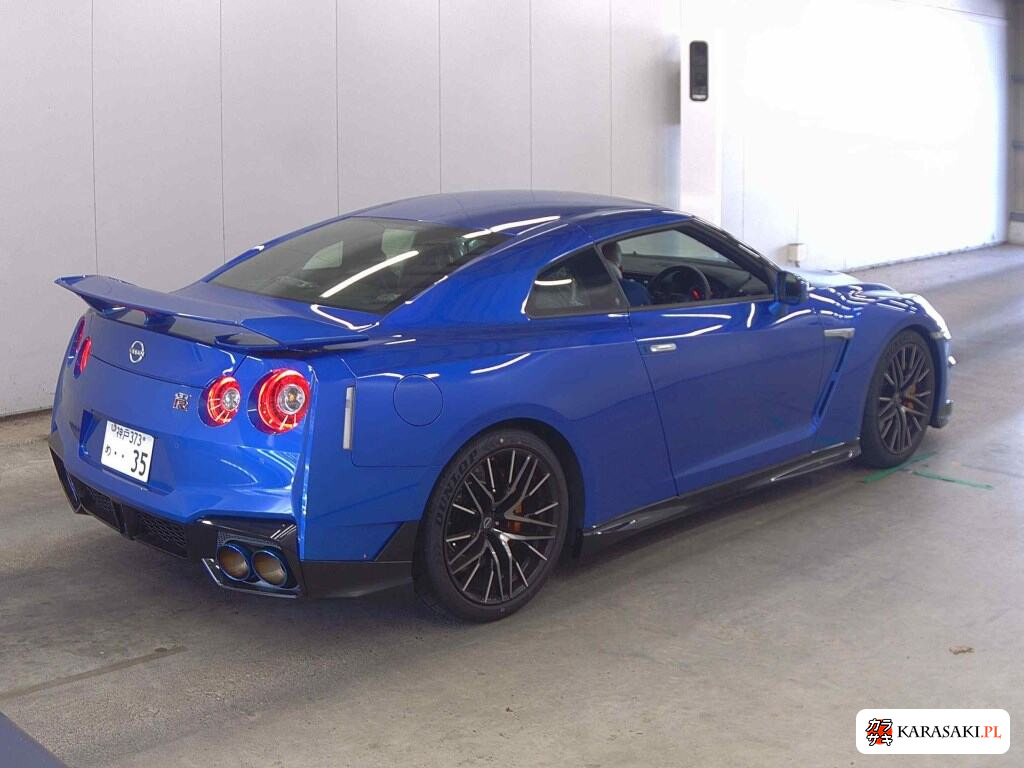
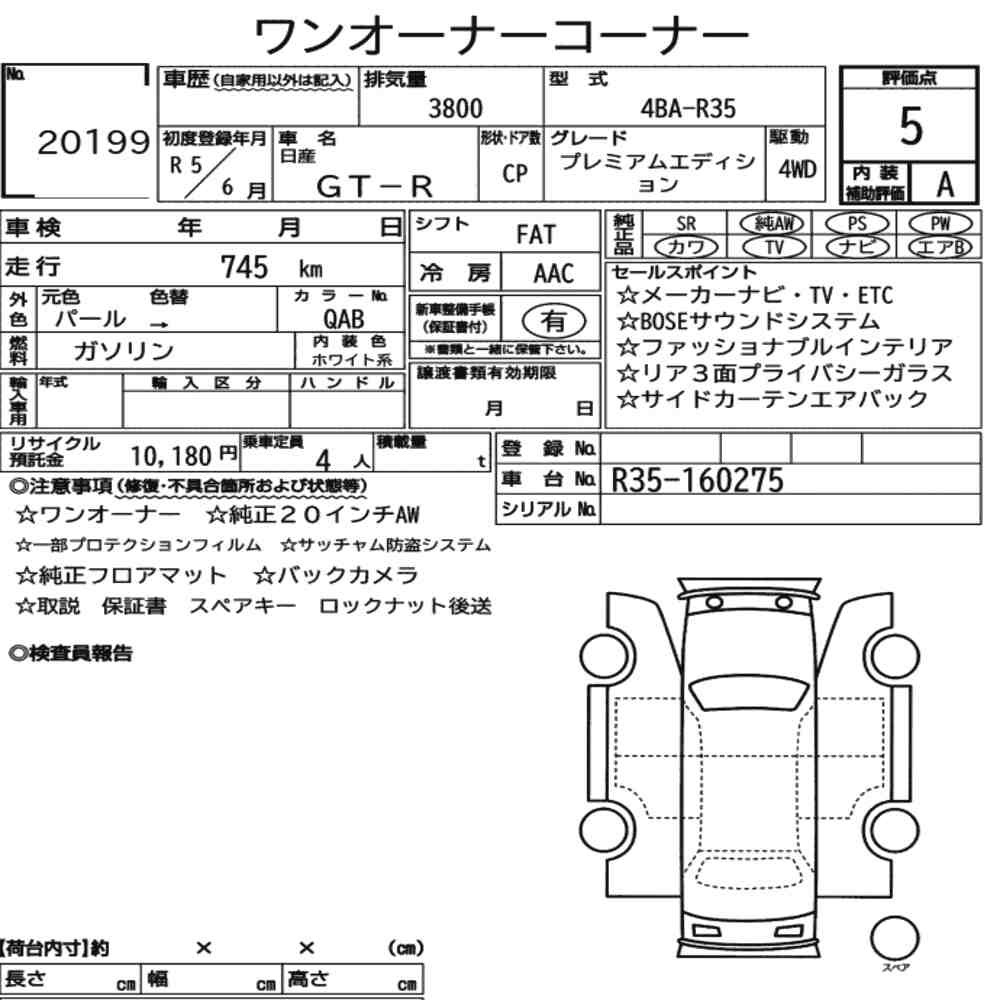
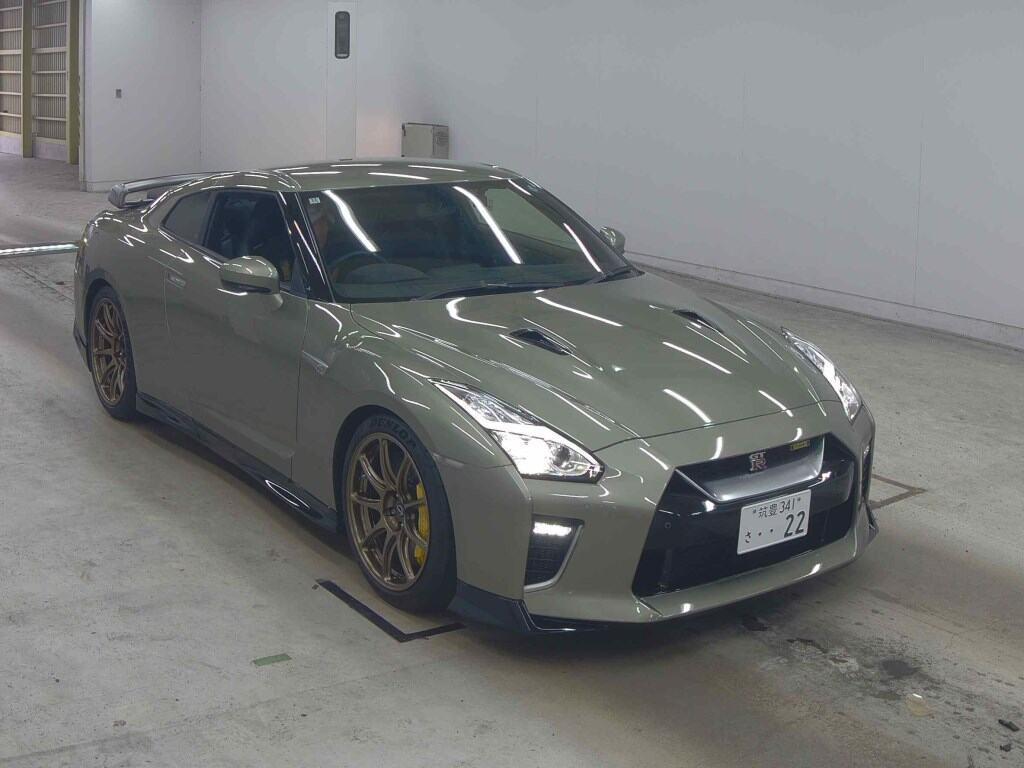
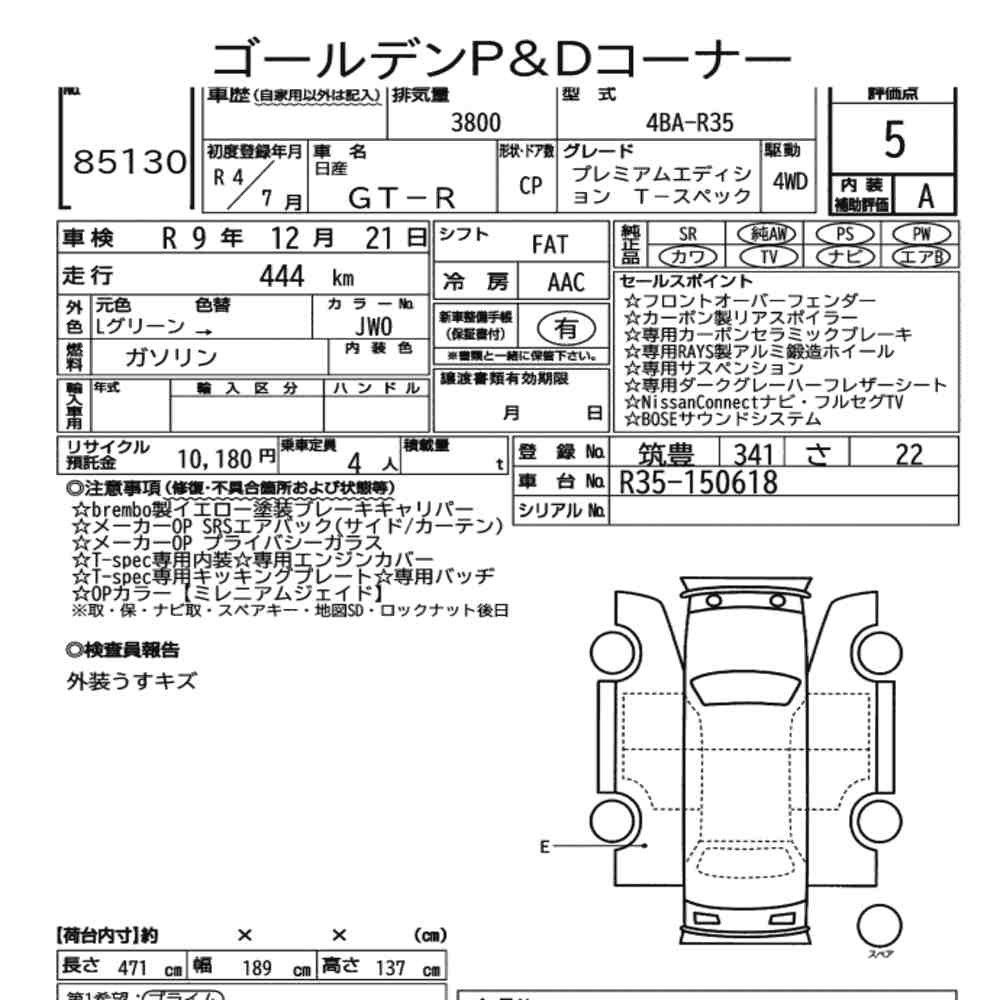
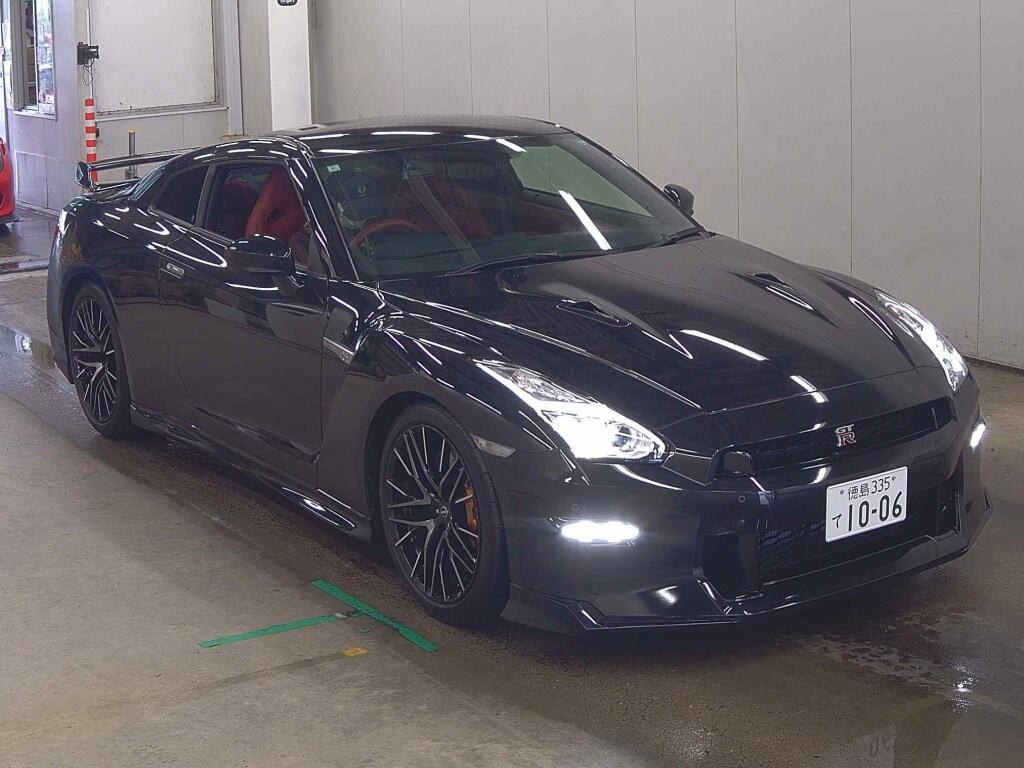
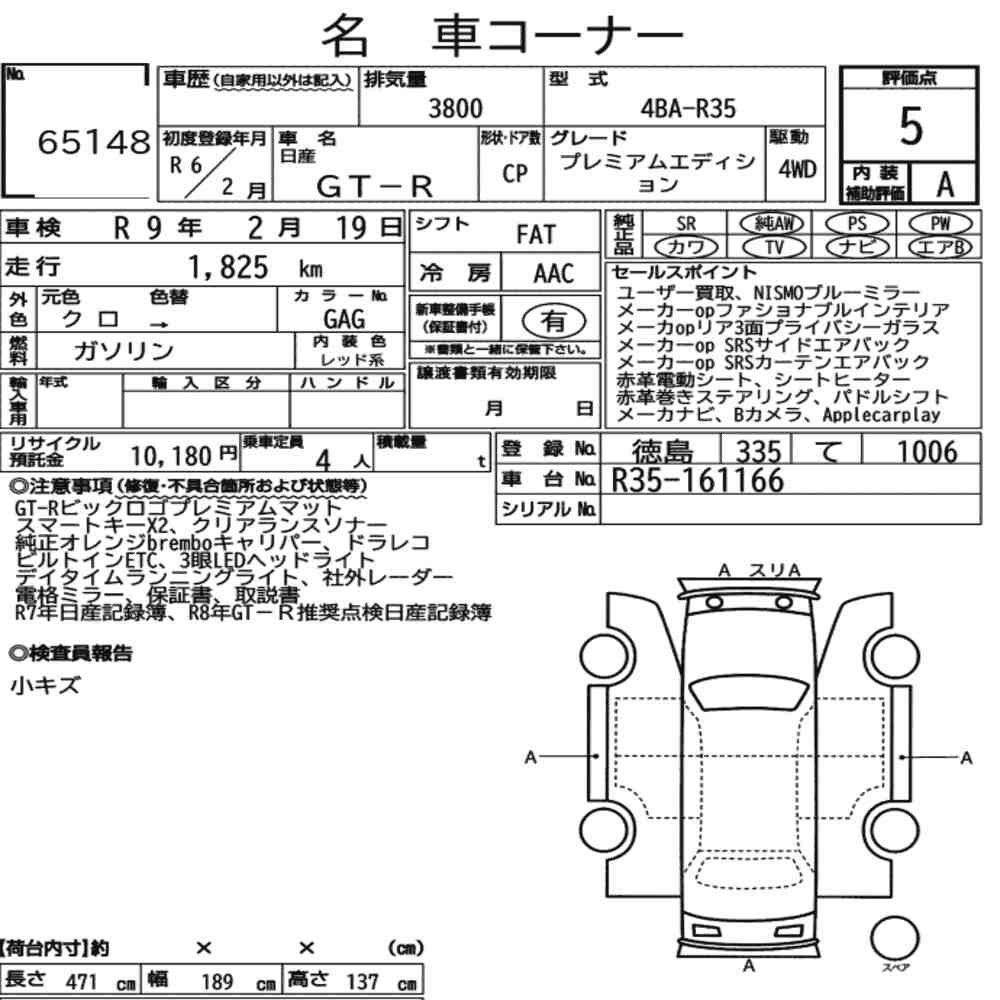
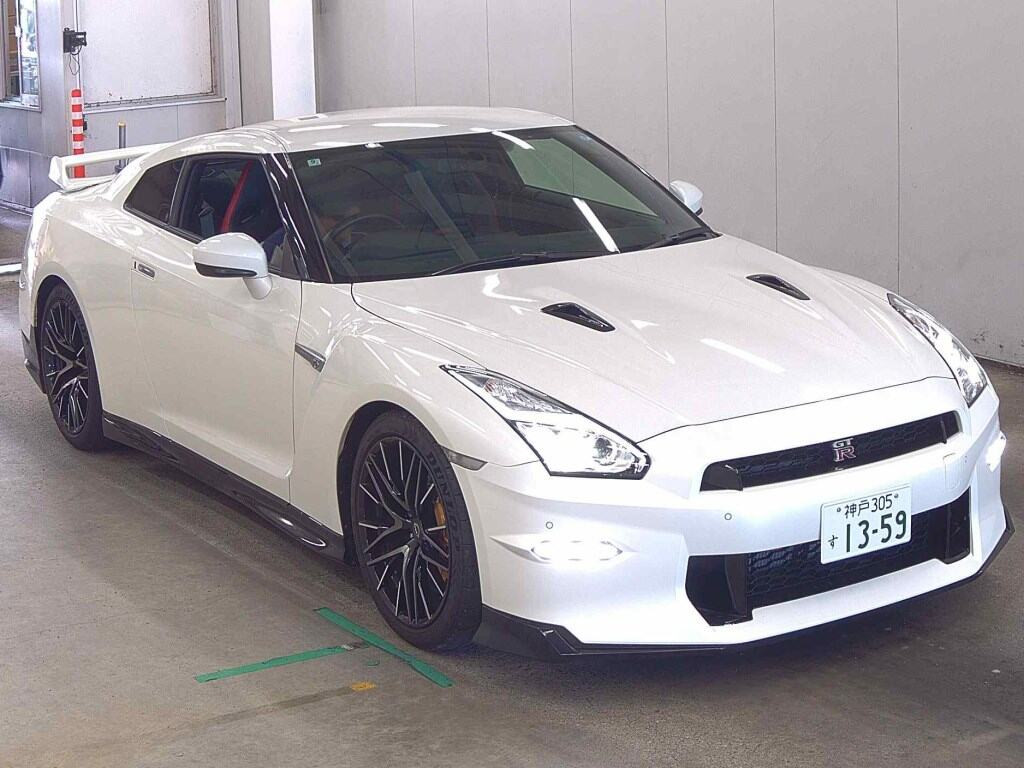
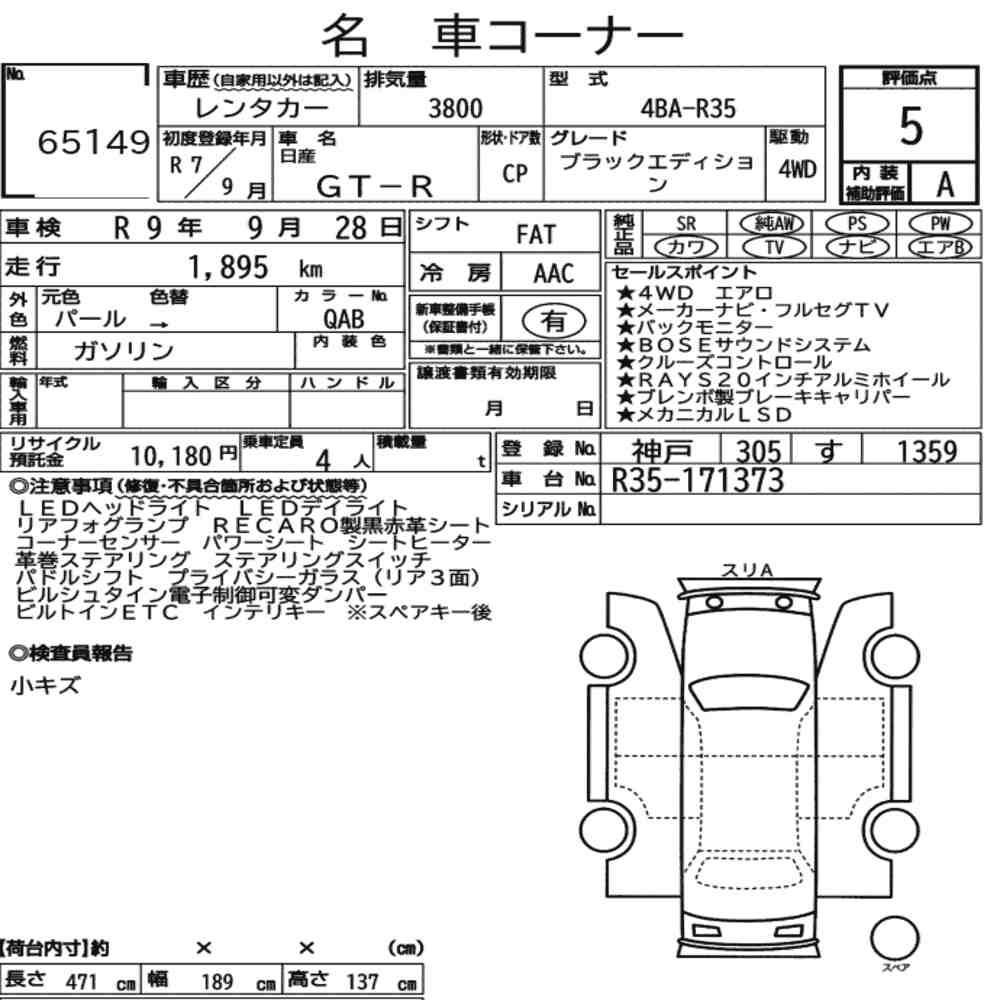
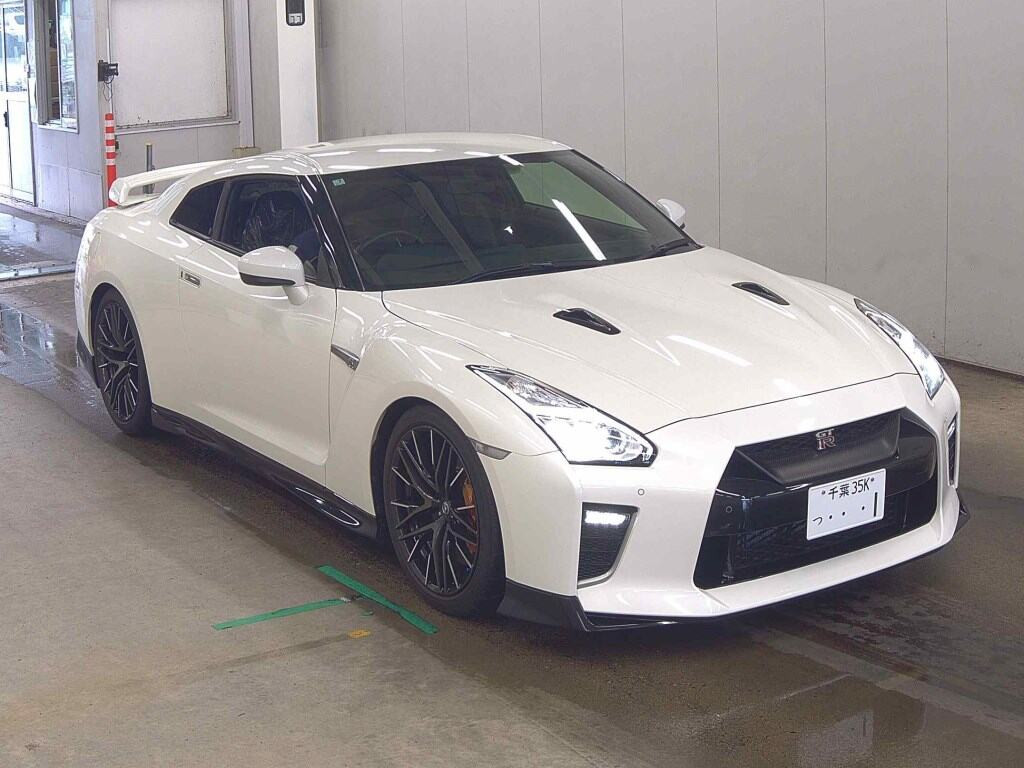
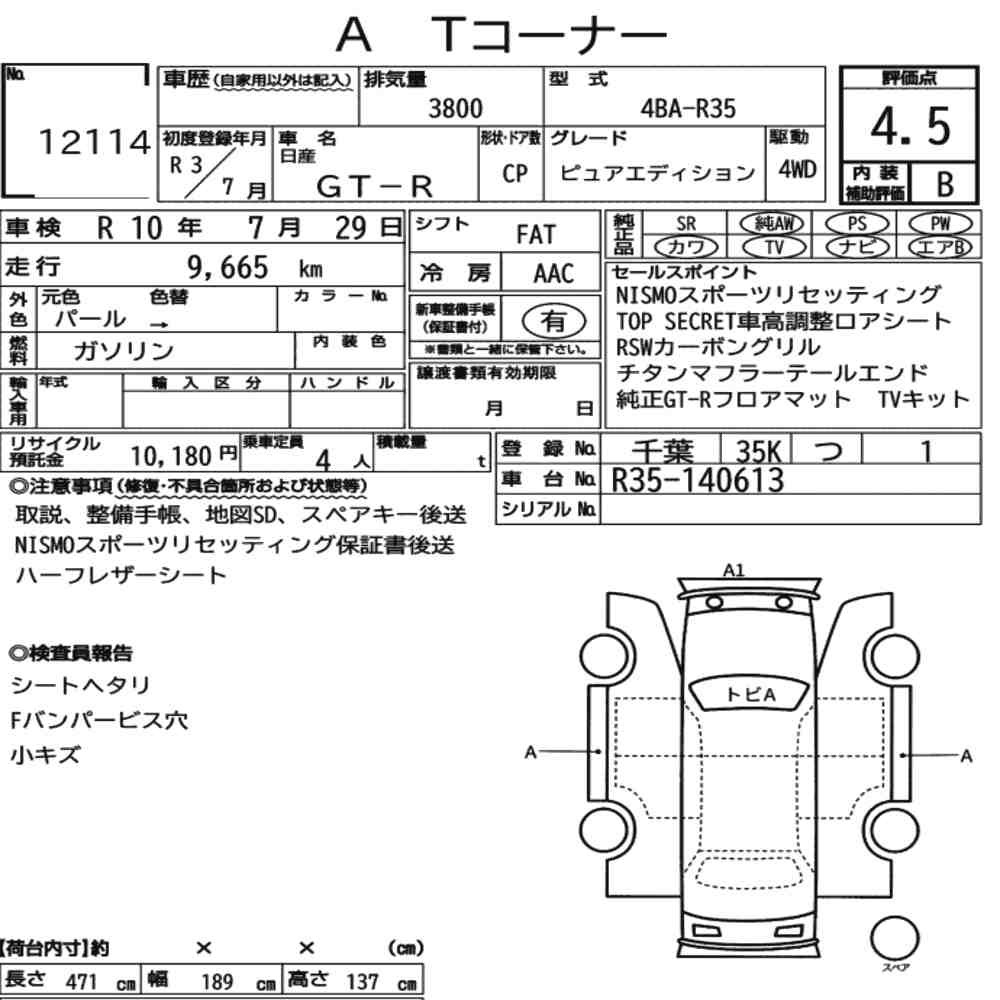
The 2017 model, on sale from 27 July 2016, makes 570 PS. From June 2019 Japanese catalogues show the type designation 4BA-R35. In September 2021 Nissan announced two T-spec versions, with 100 cars planned in total and sold by lottery. The catalogue holds about 53 cars with a median mileage of 12,000 km (as of 21 September 2026).
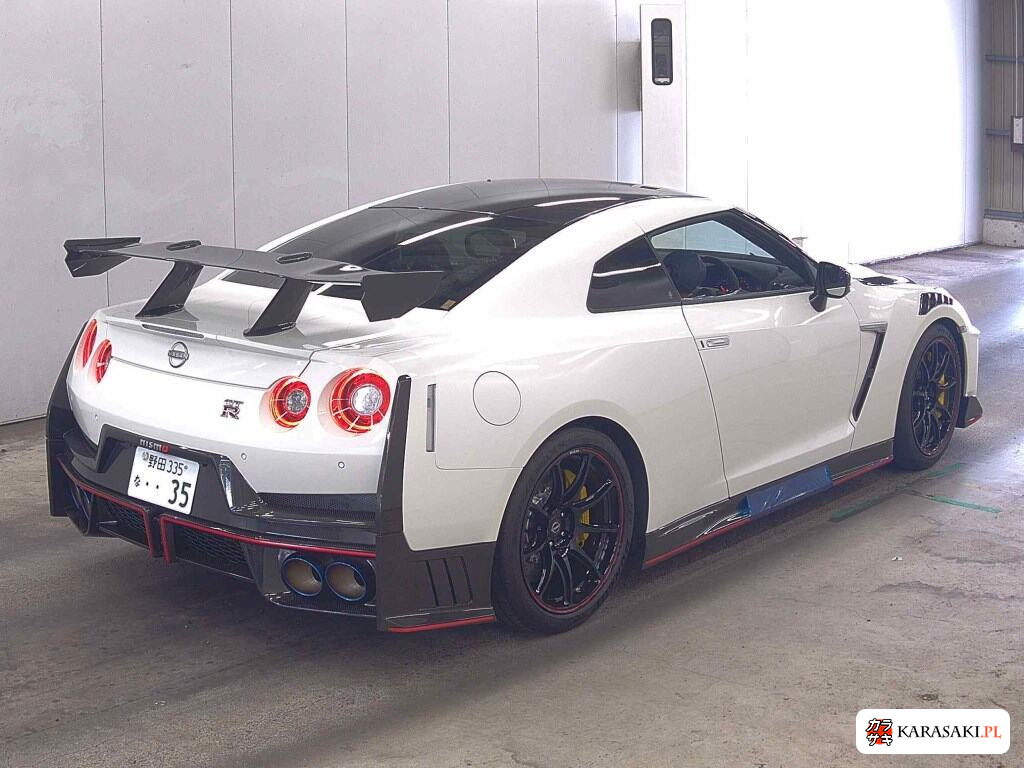
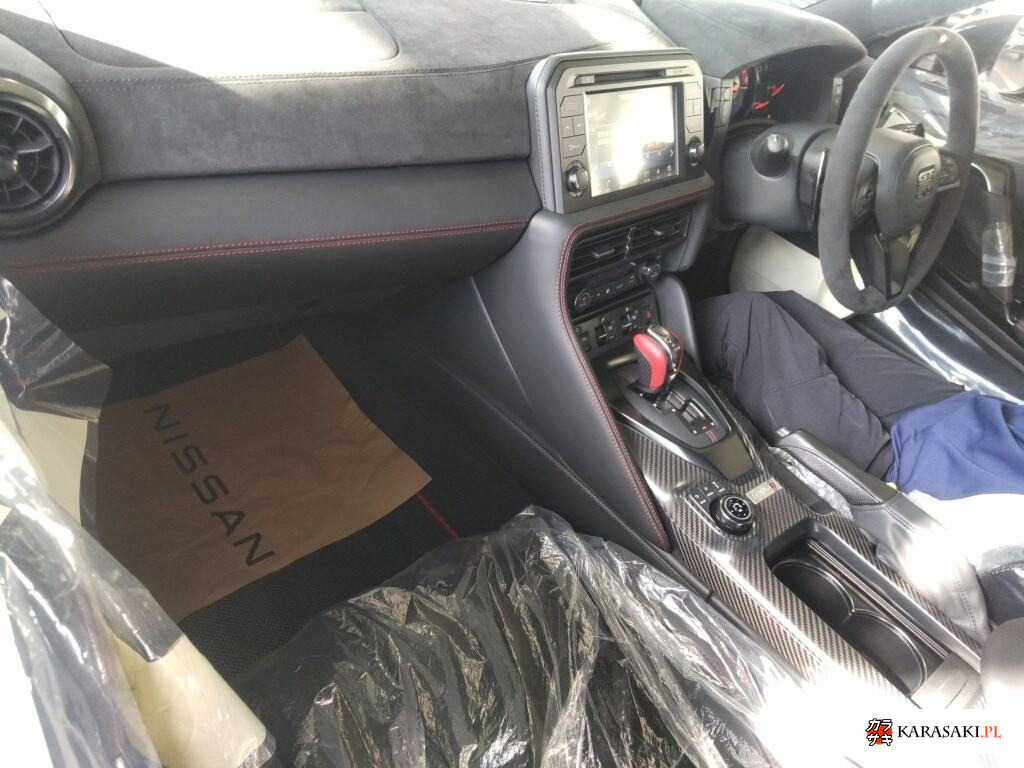
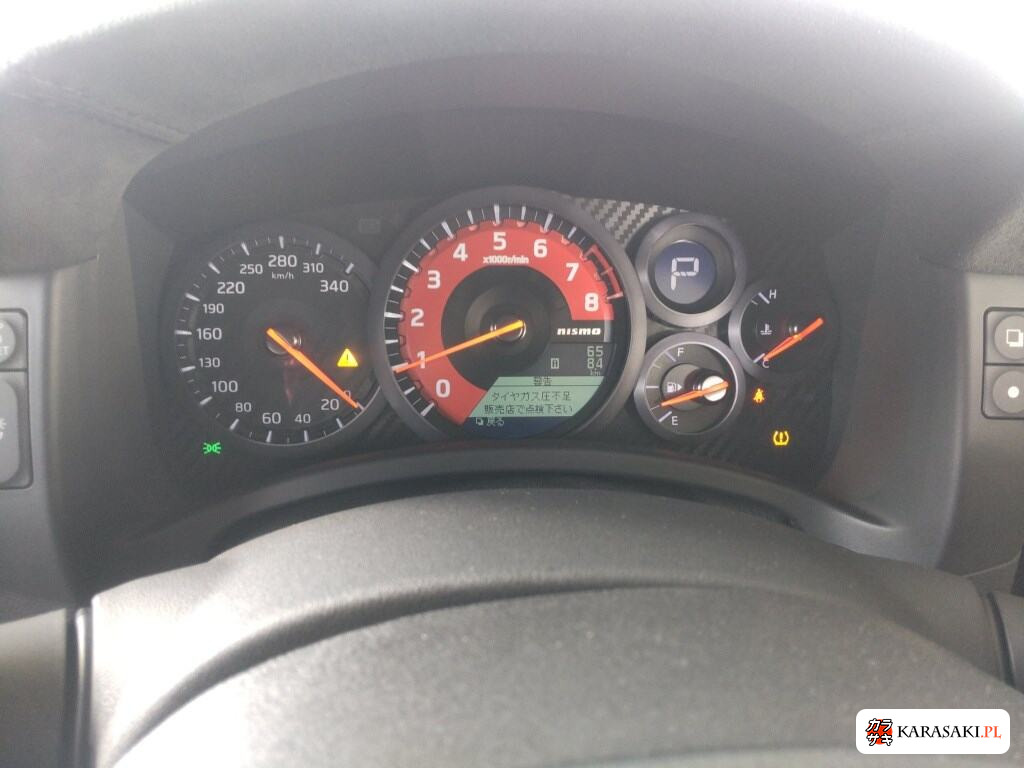
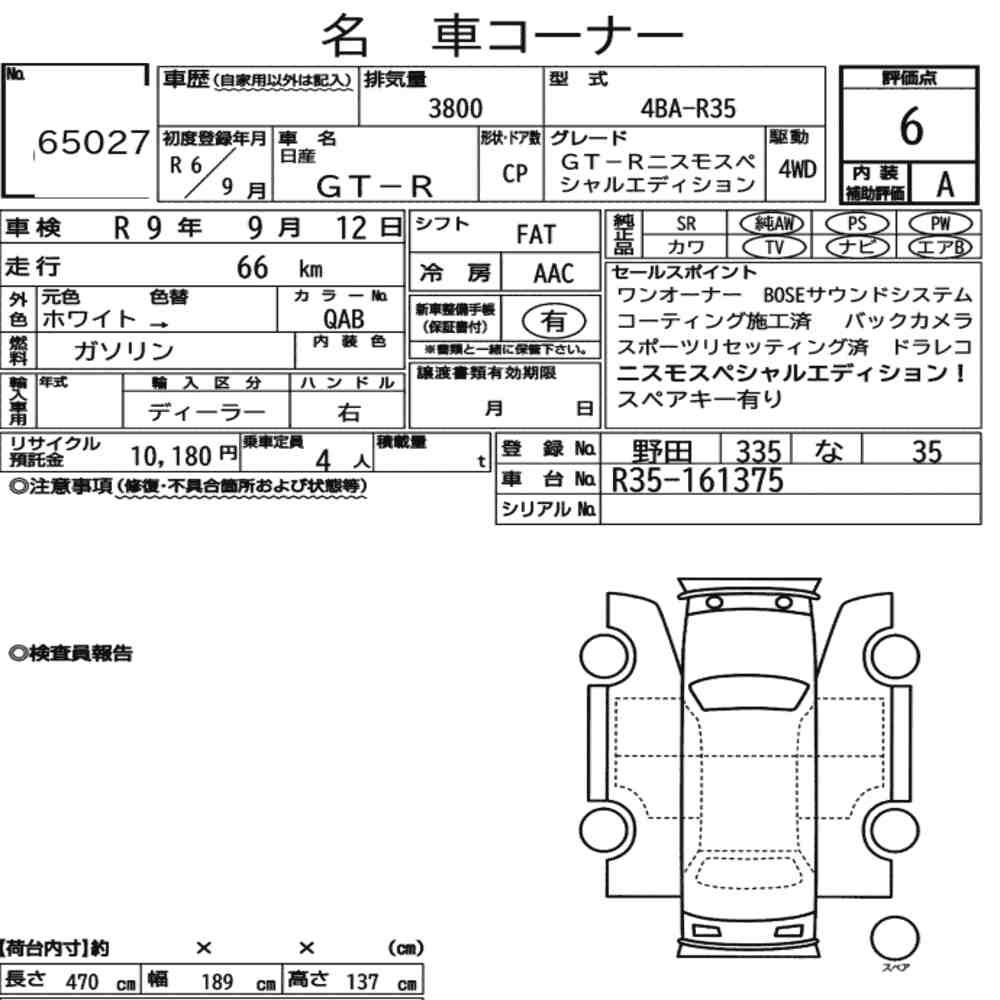
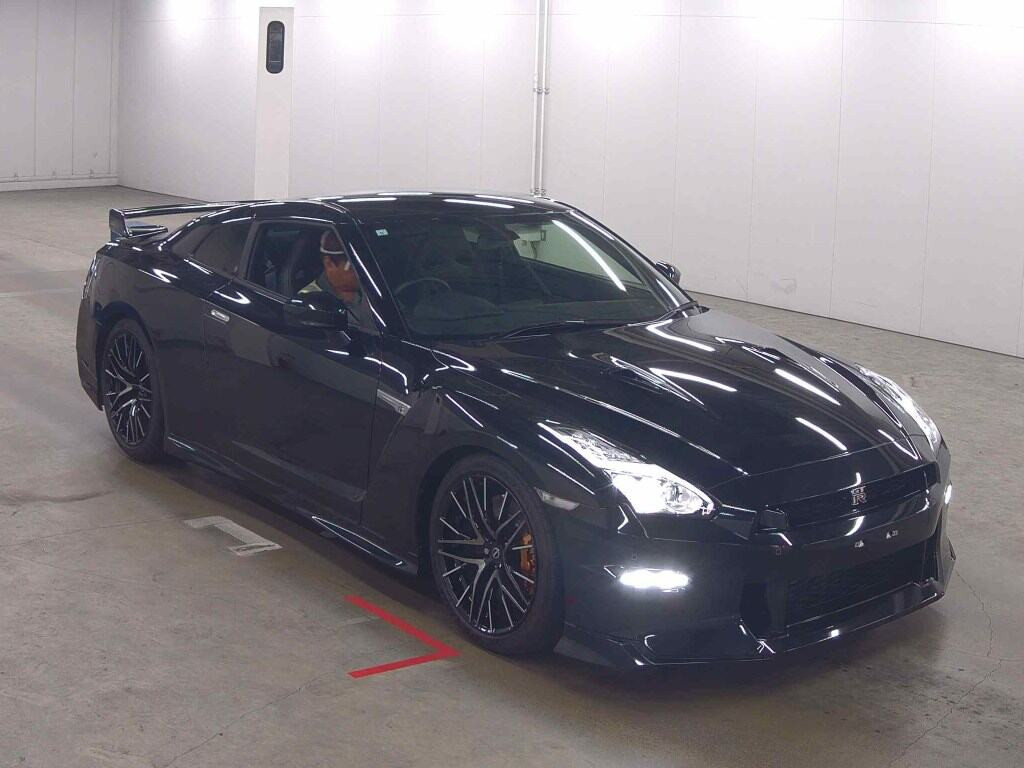
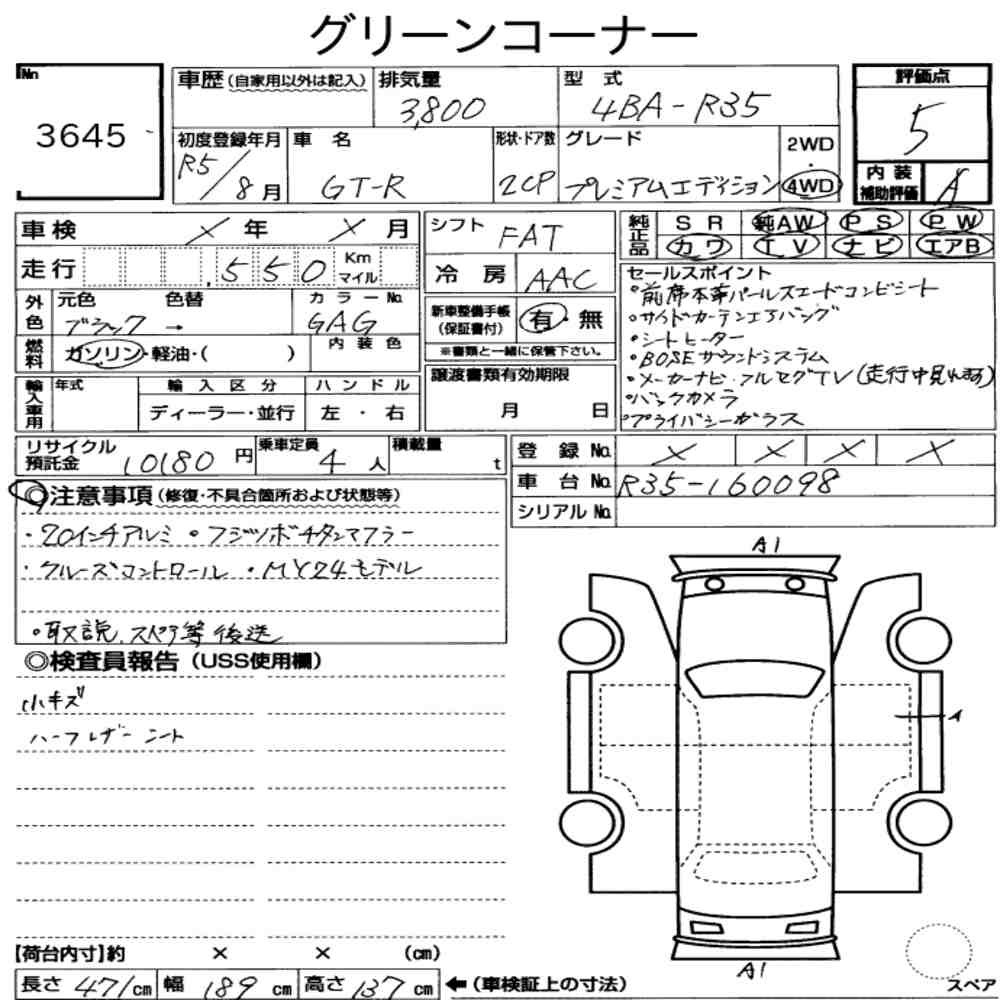
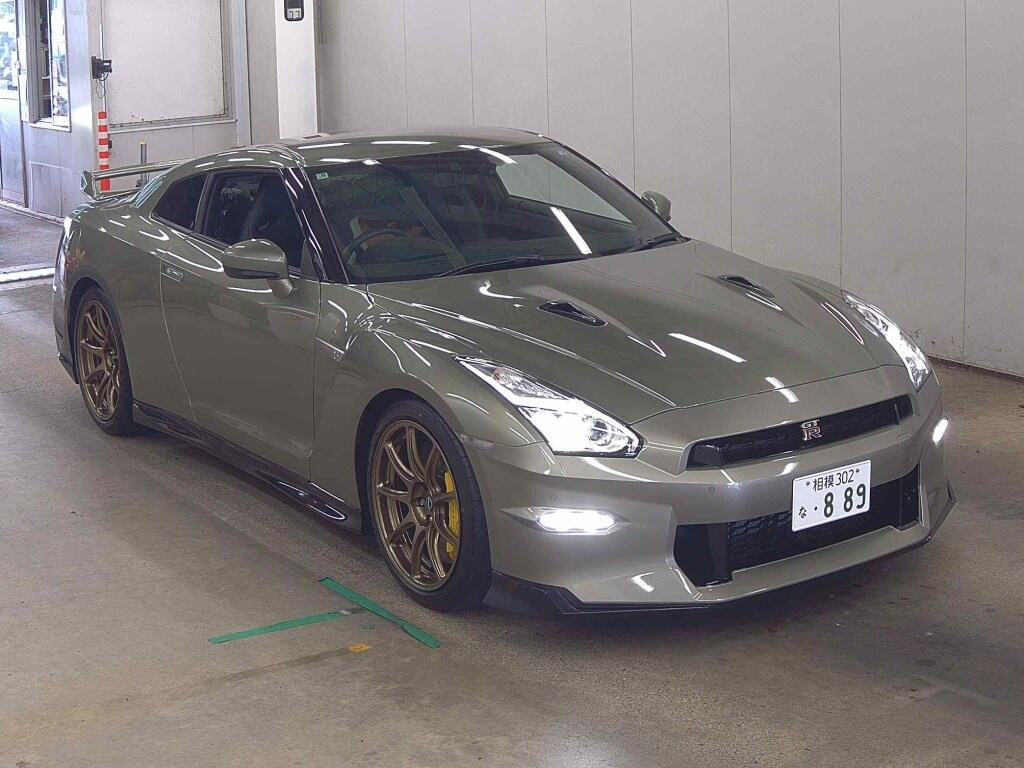
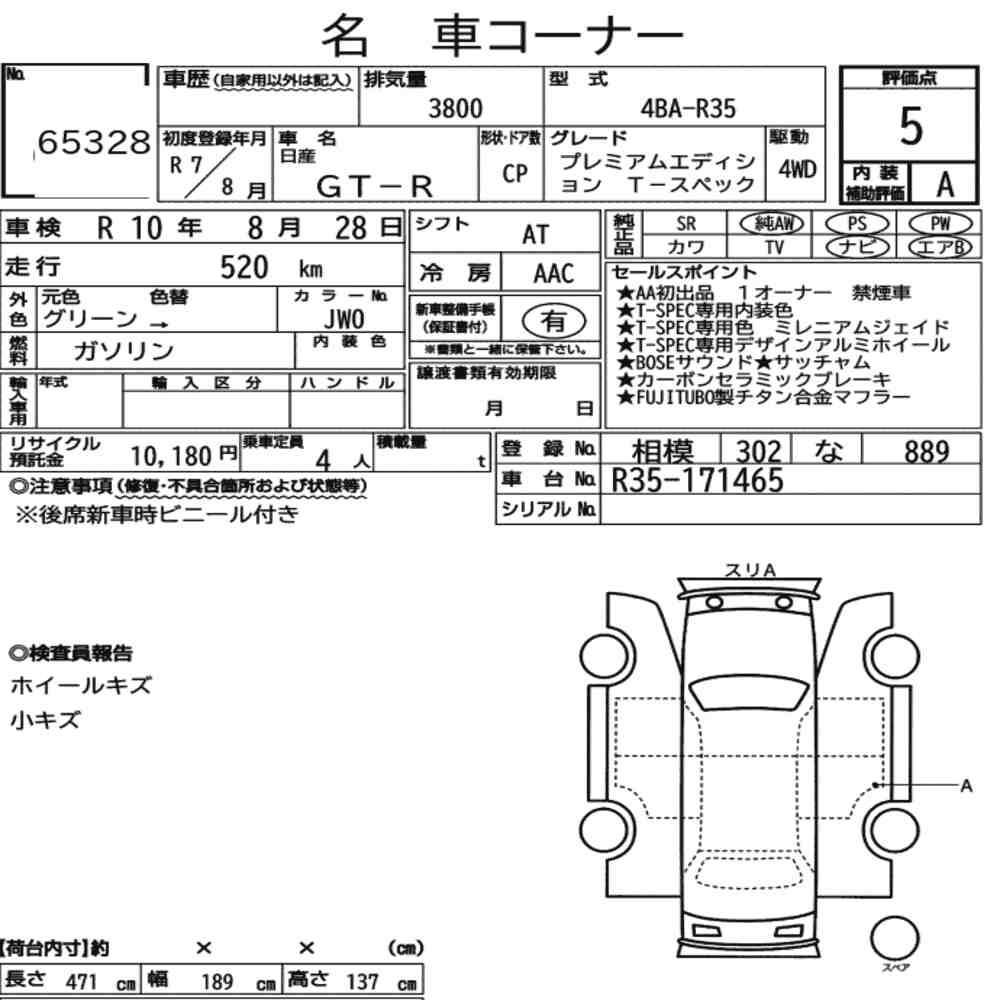
Model years 2023 to 2025: 208 listings
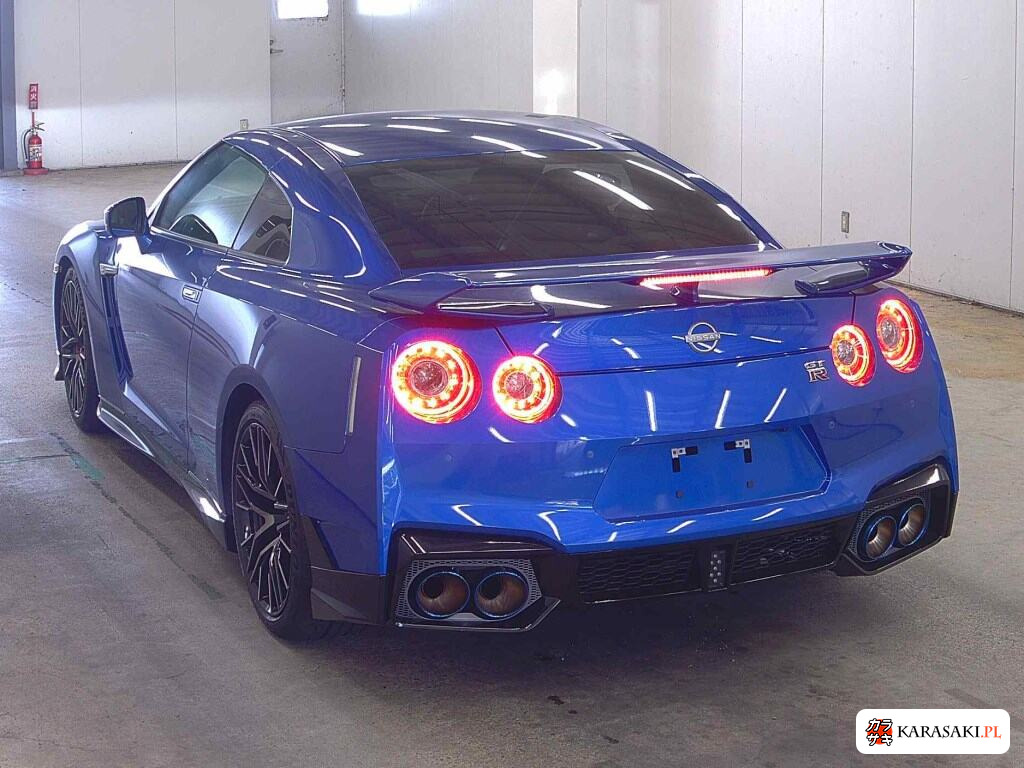
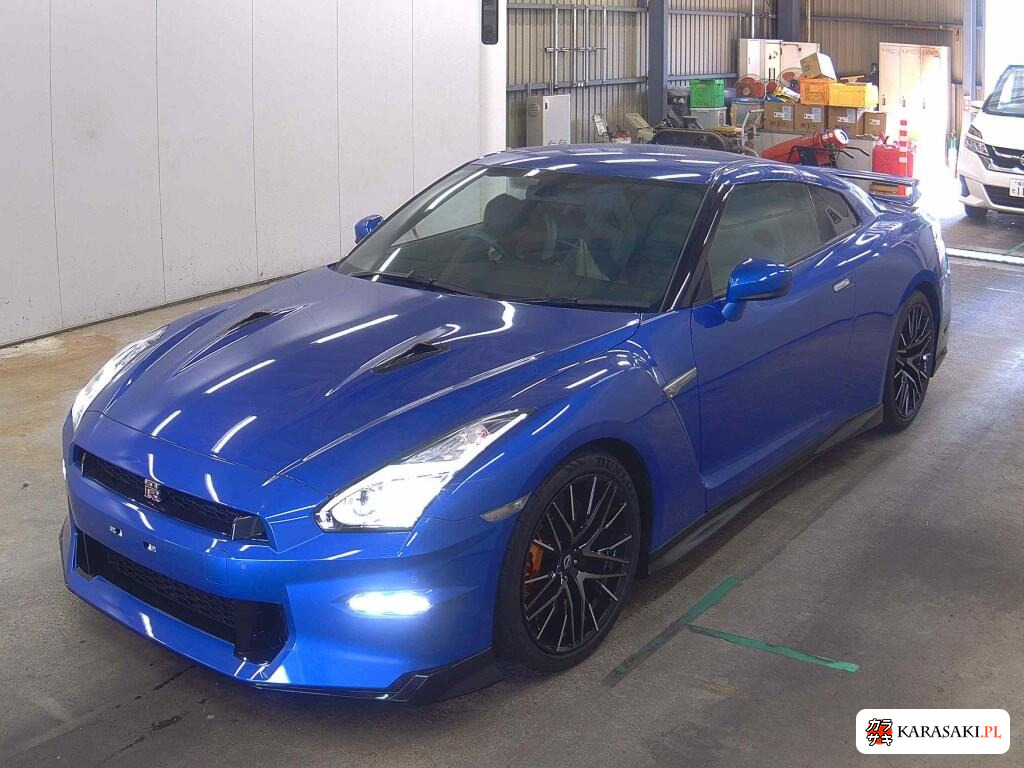
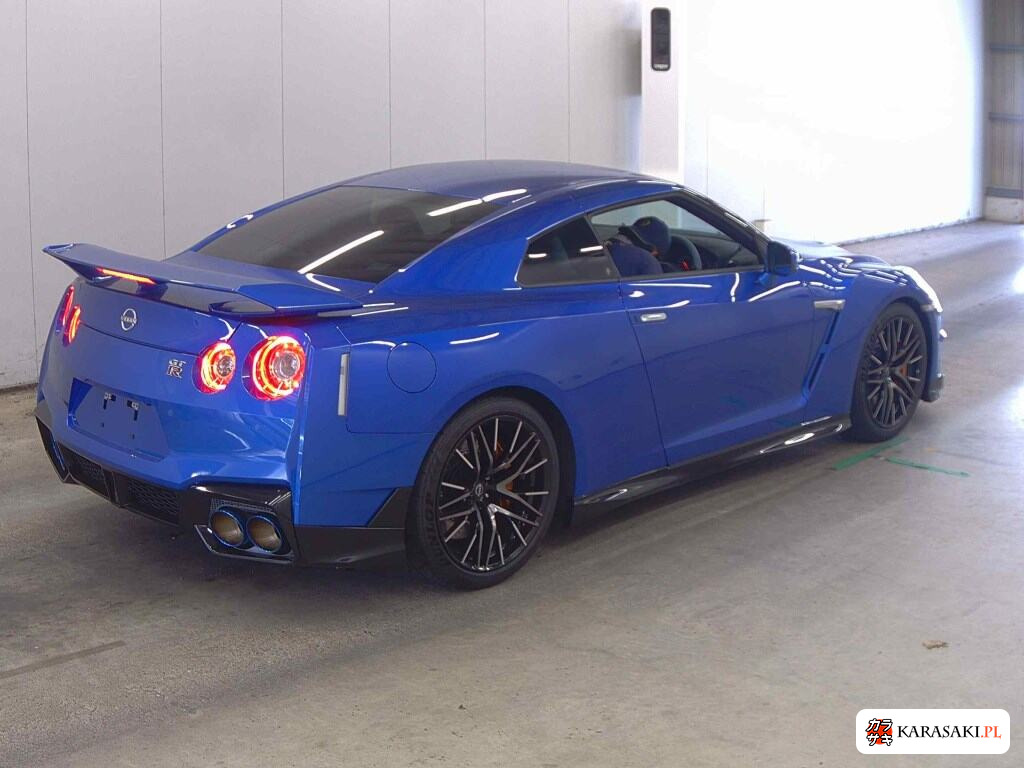
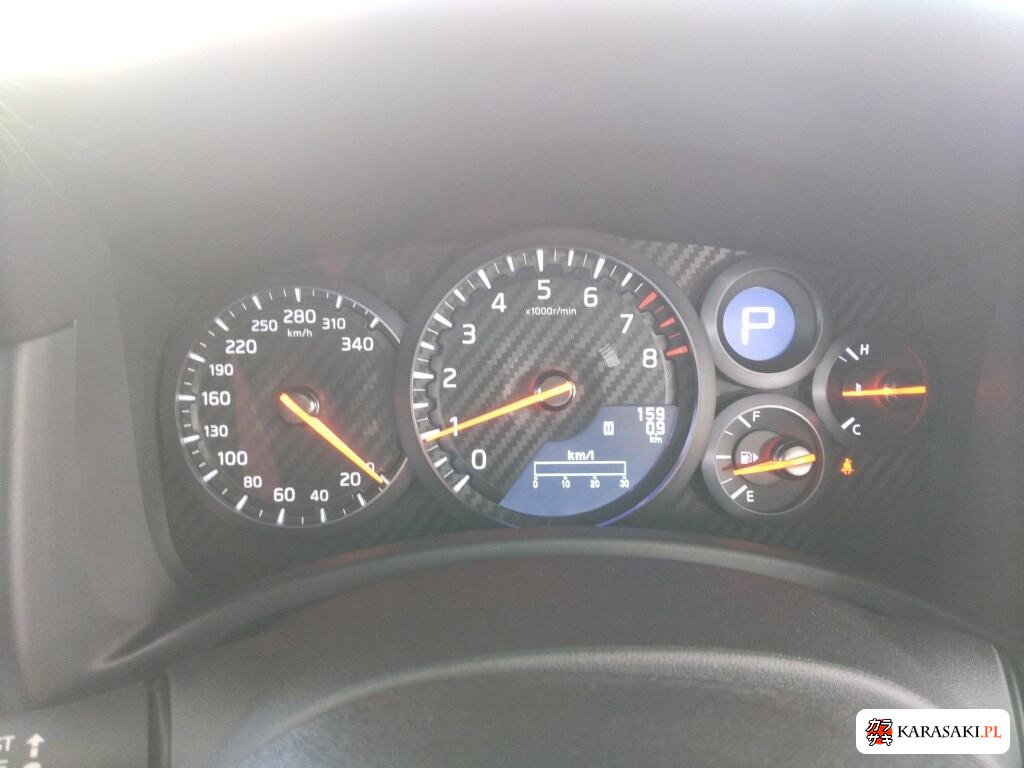
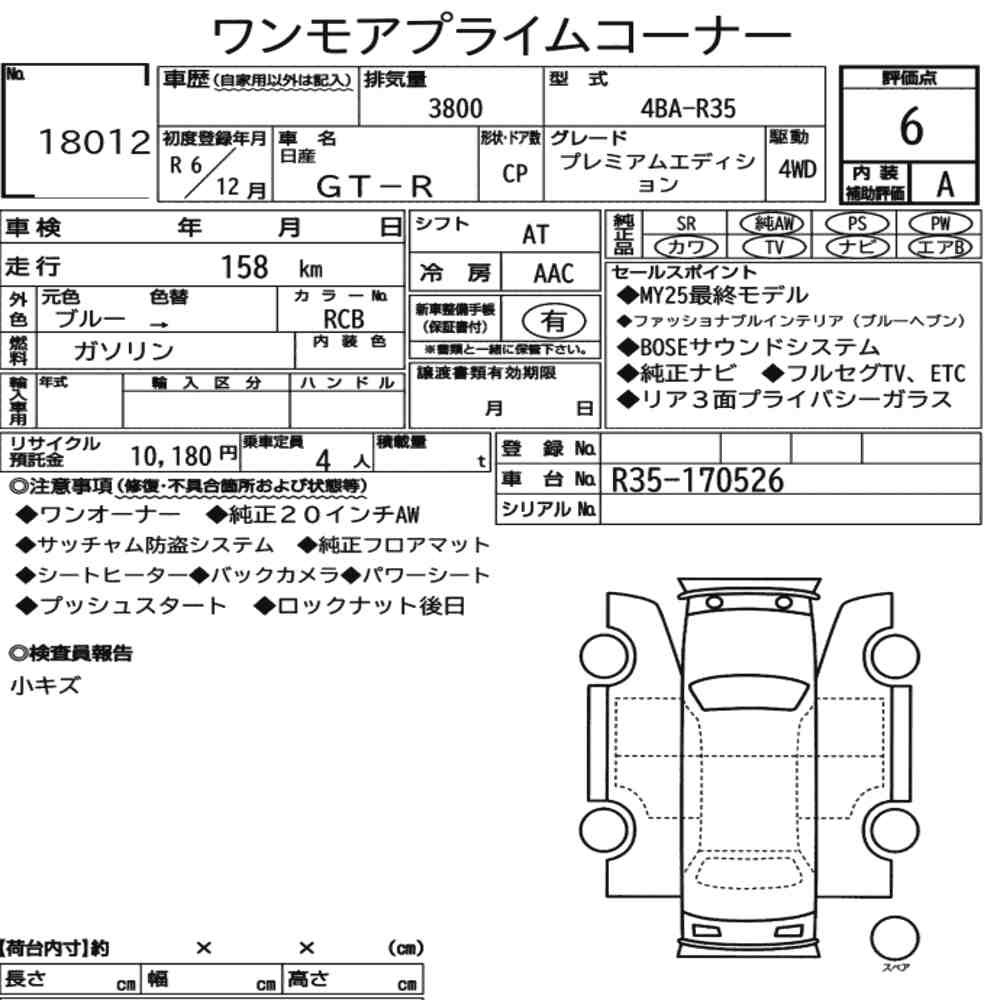
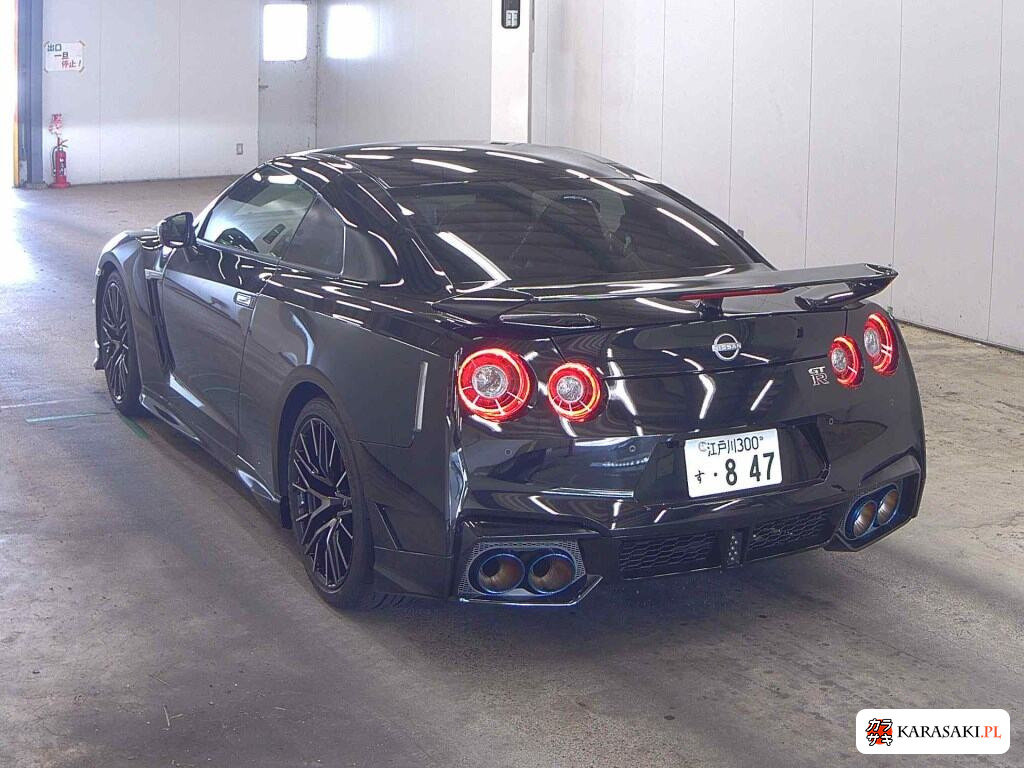
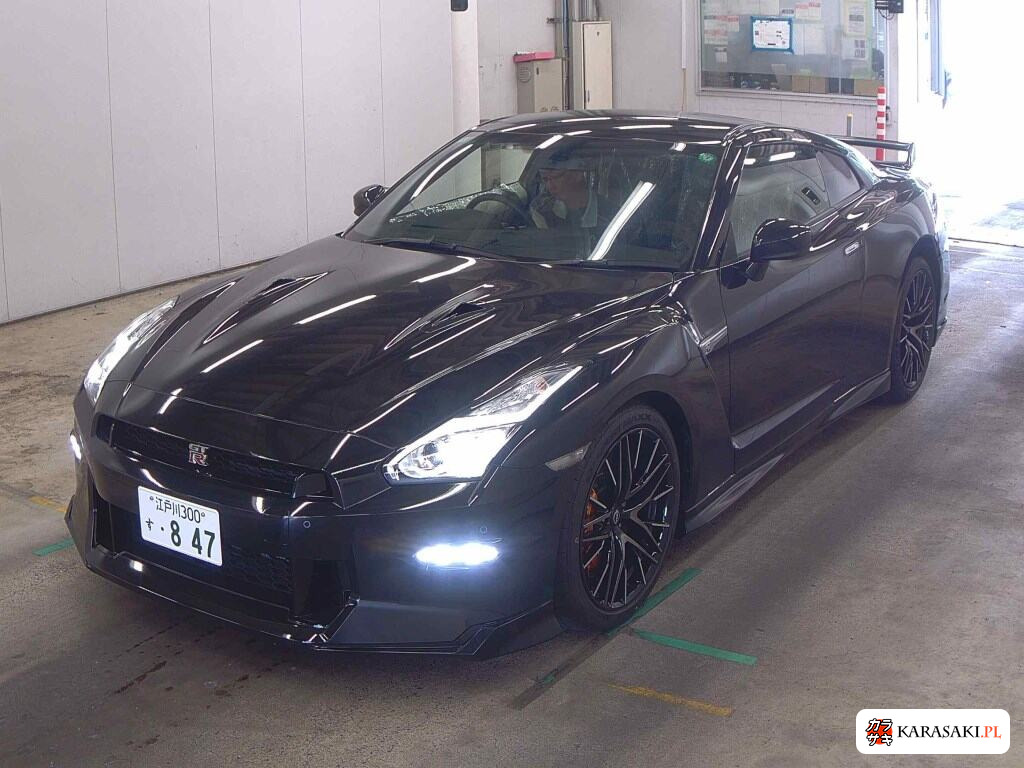
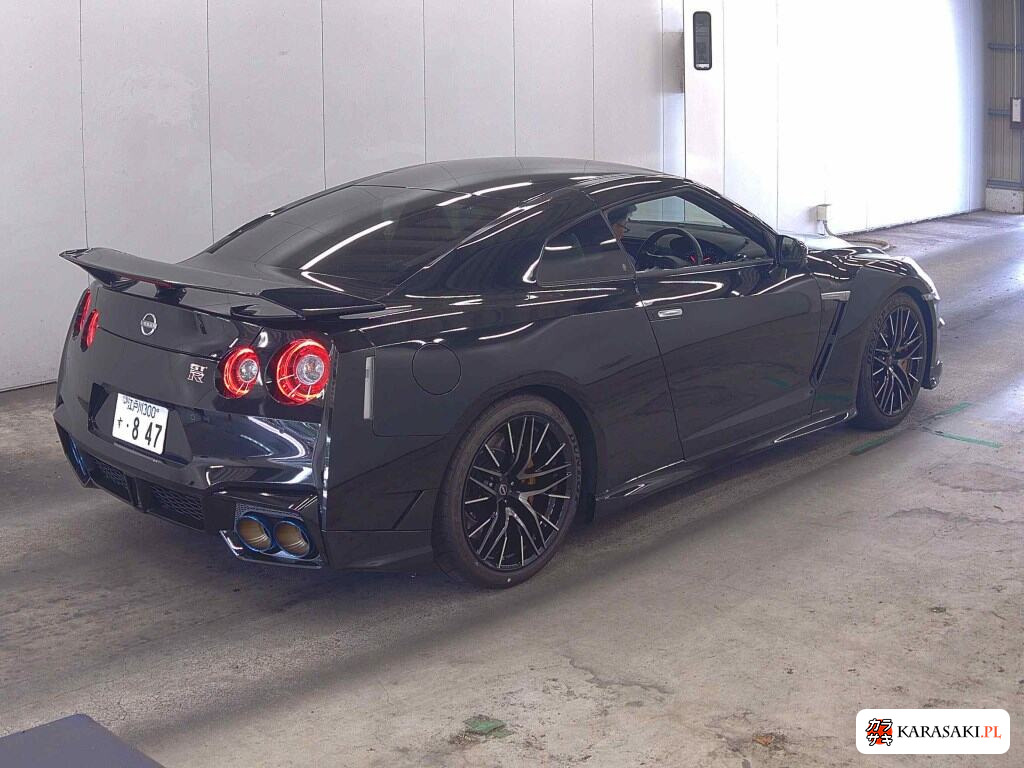
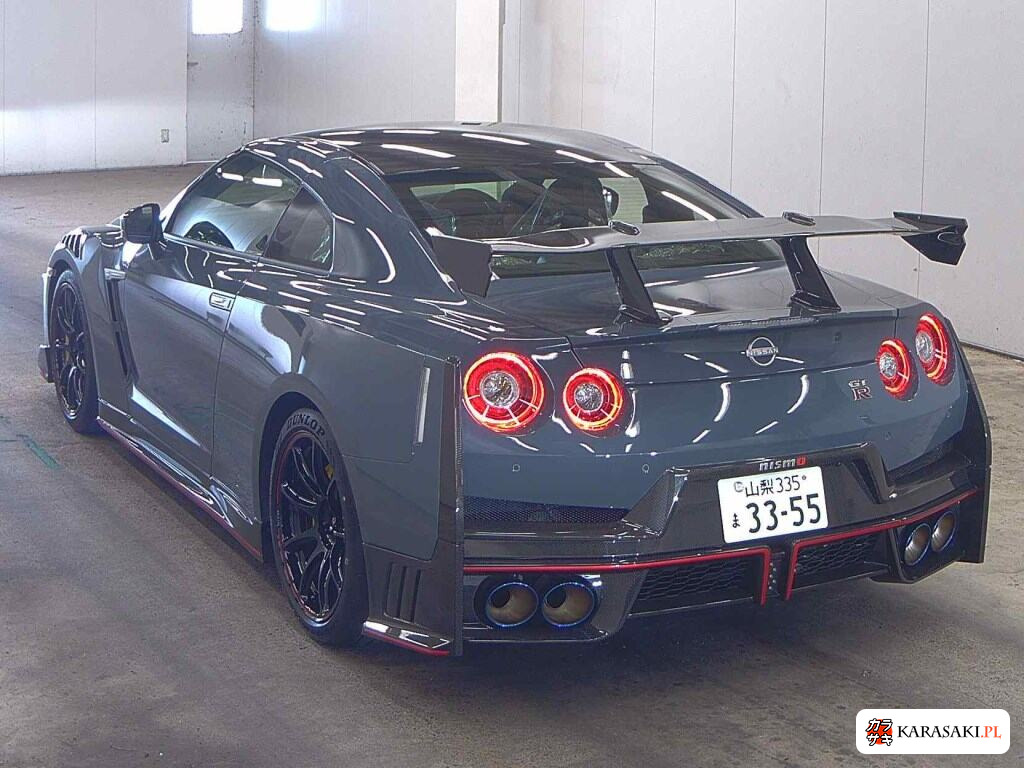
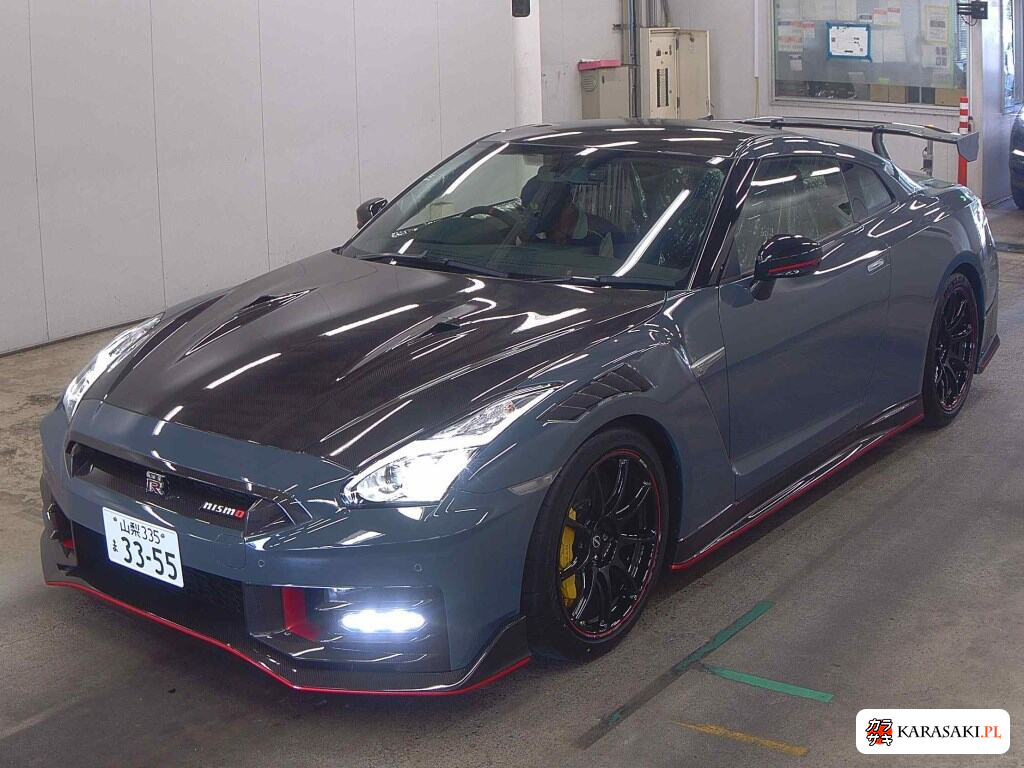
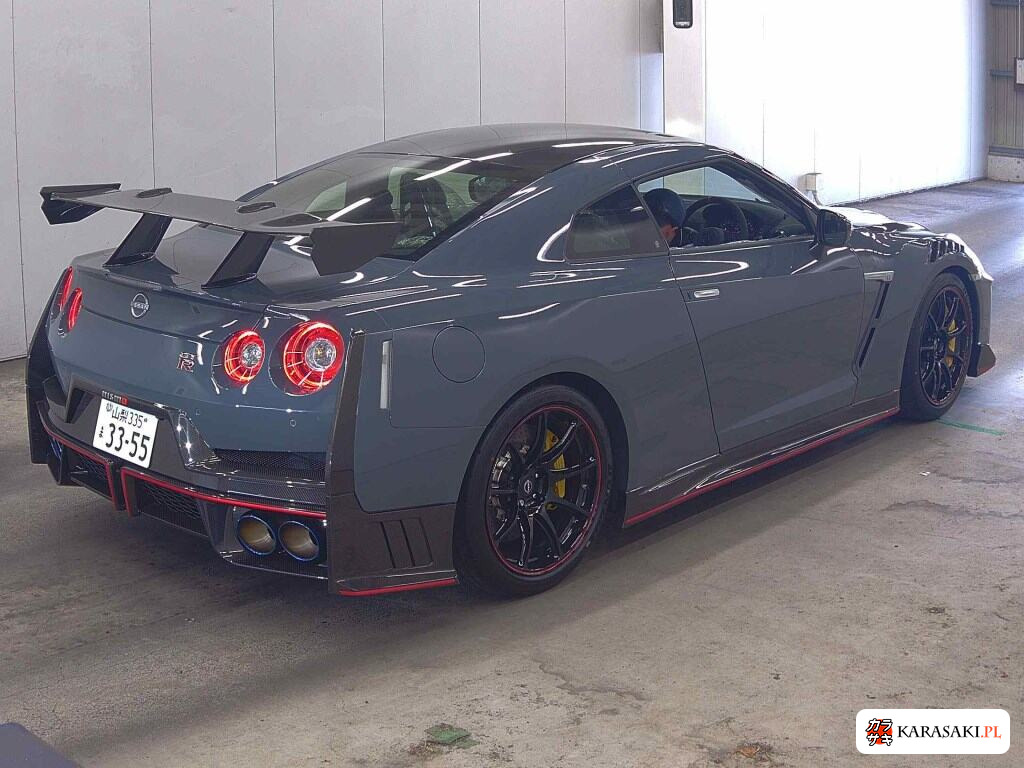
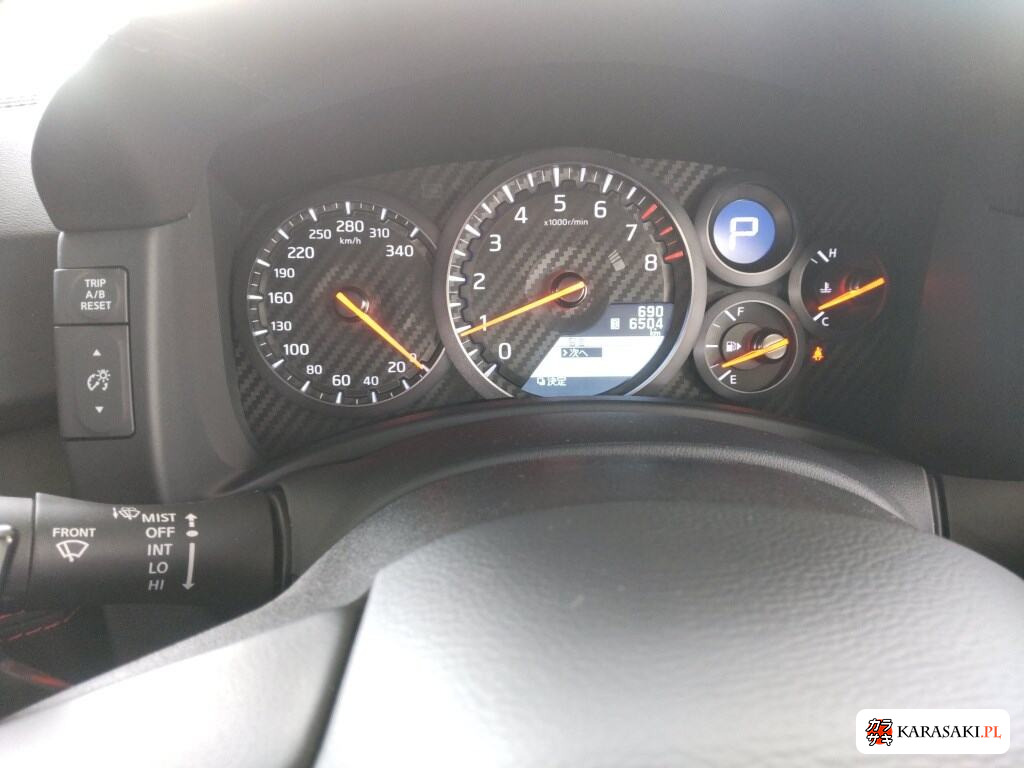
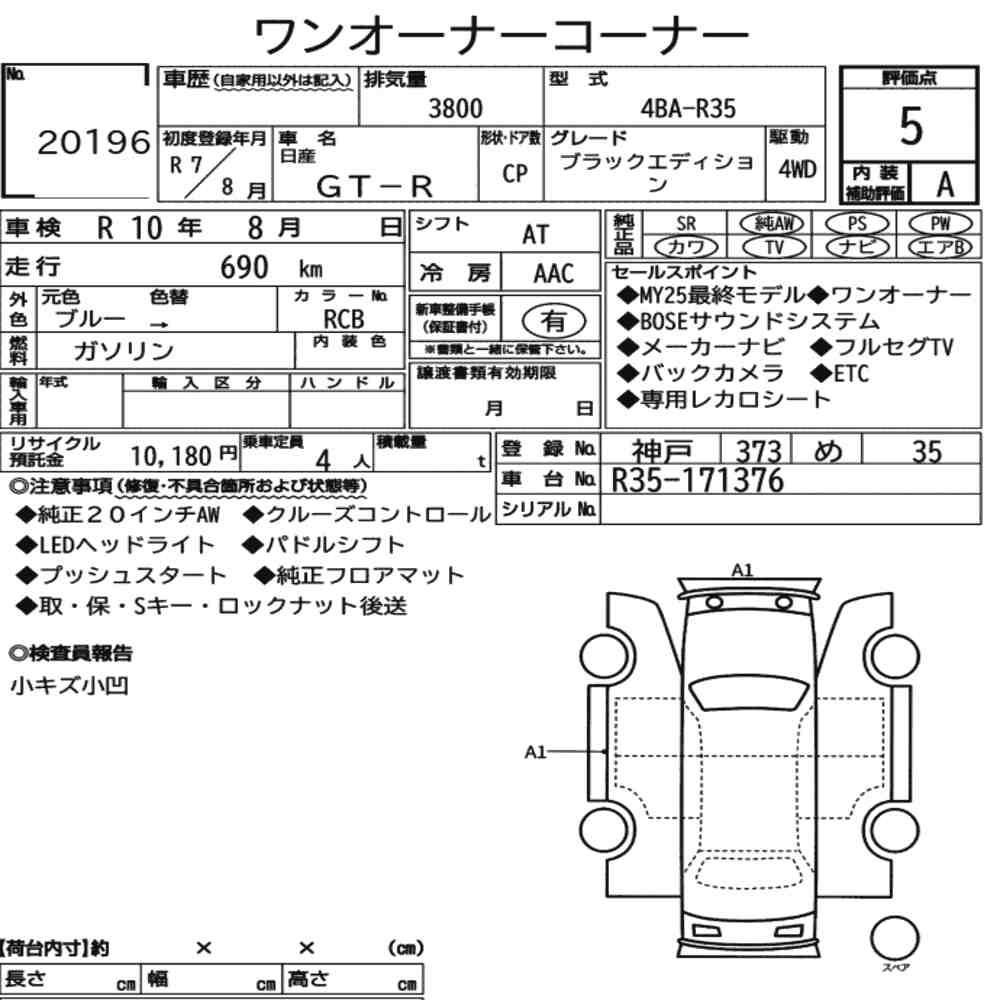
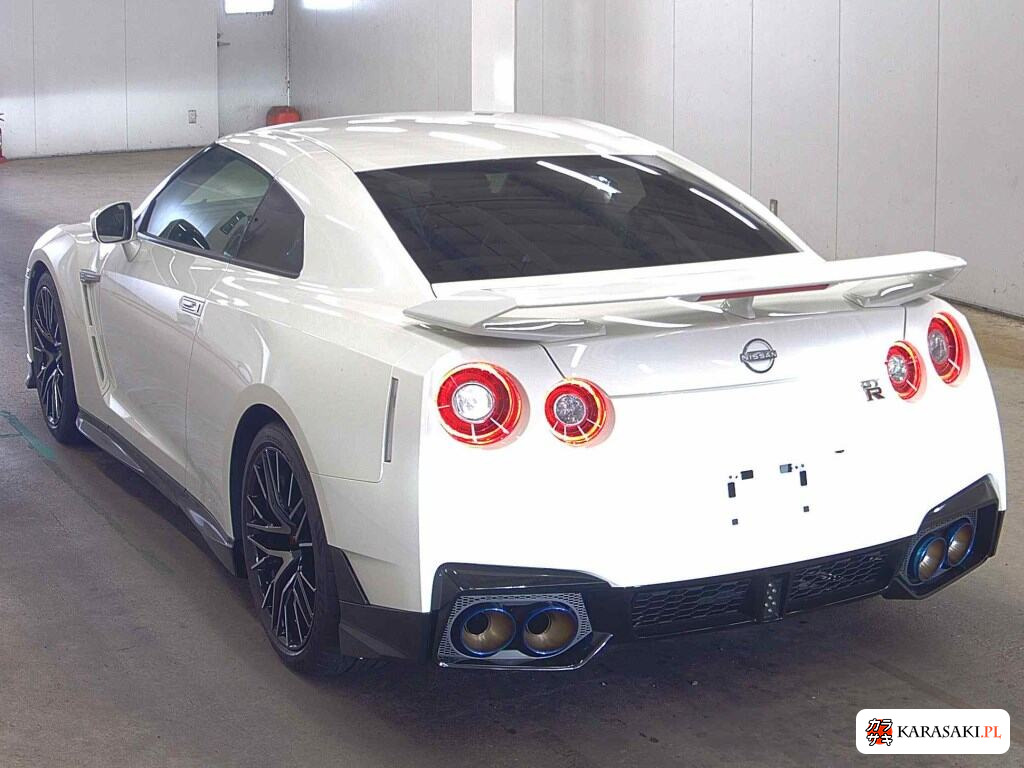
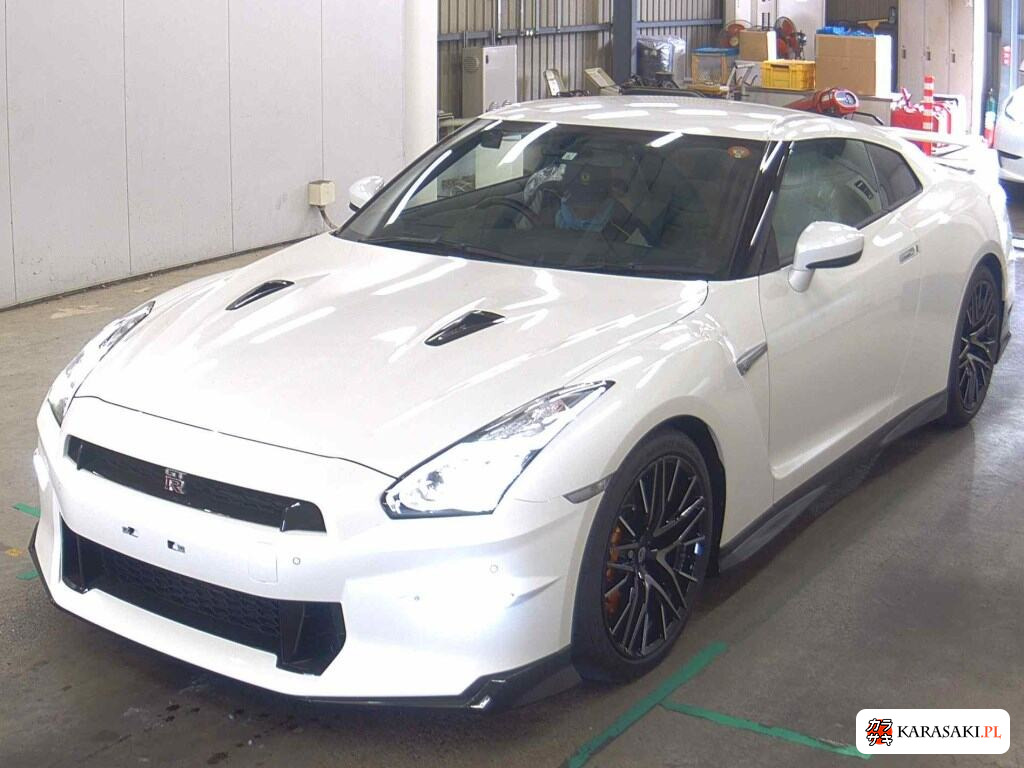
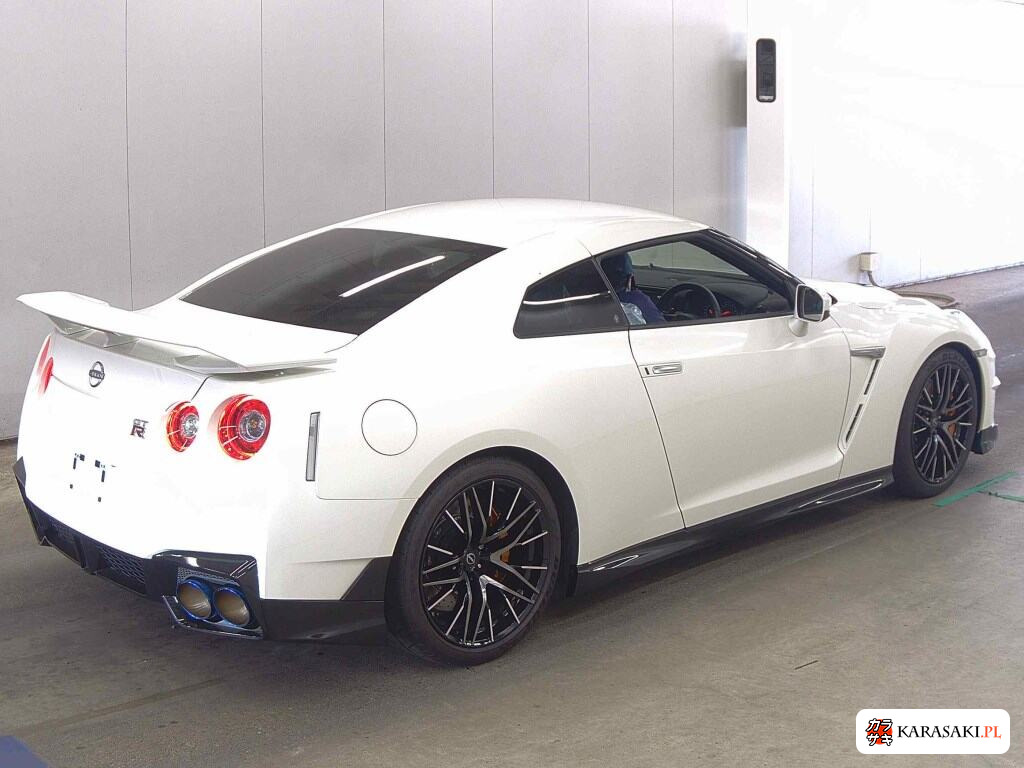
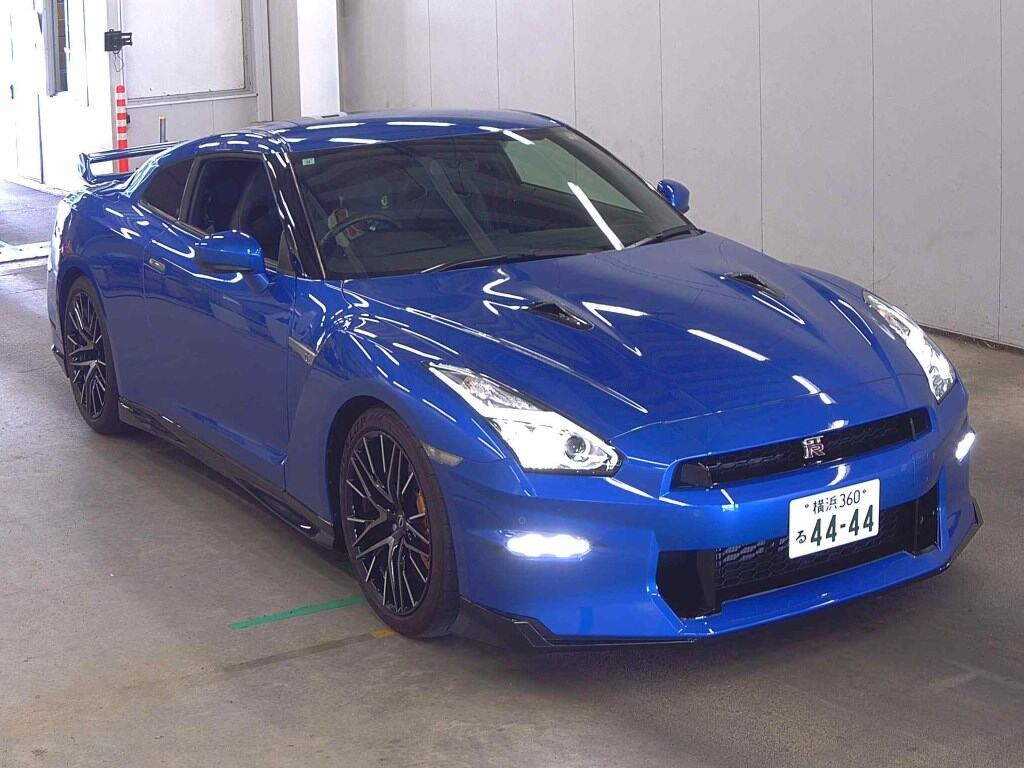
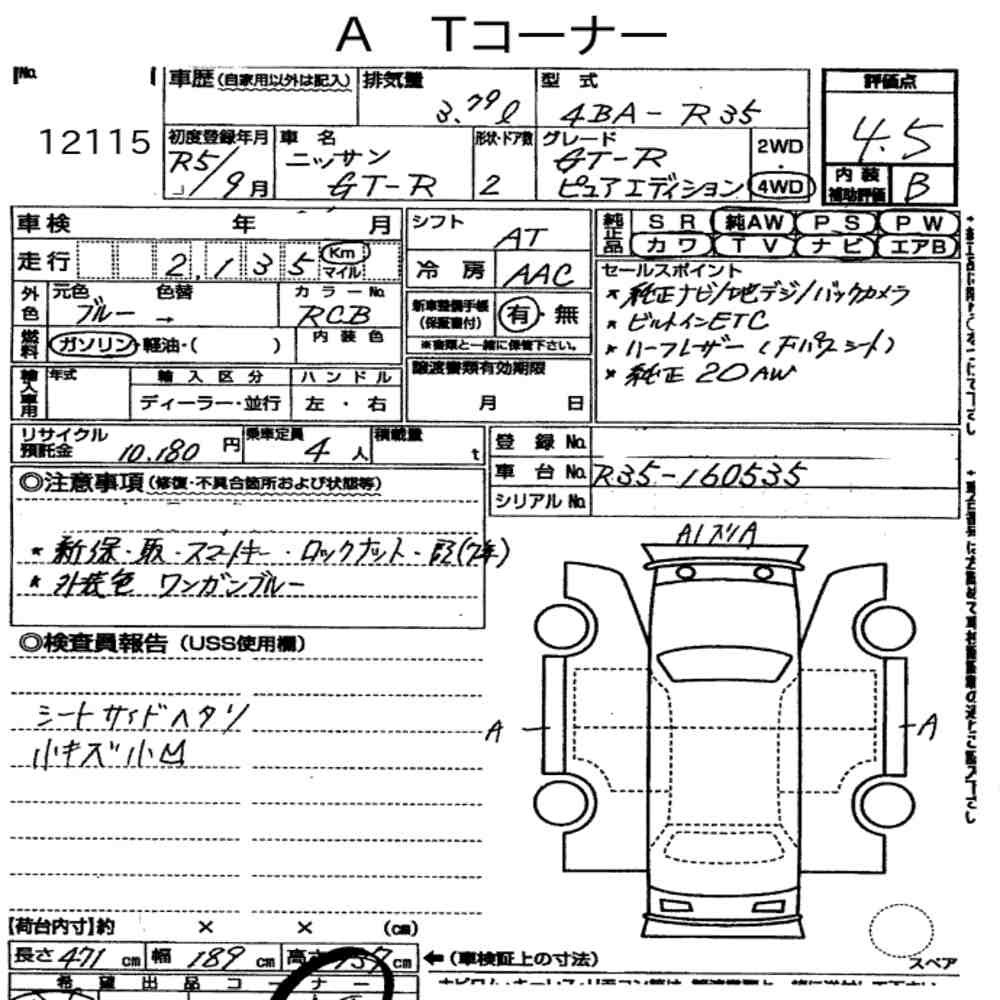
Almost half of the 431 listings (as of 21 September 2026), but only about 59 different cars. Nearly new examples with a median mileage of 2,000 km keep returning to later auctions, averaging 3.5 listings per car against 1.5 in the oldest group. In August 2025 Nissan announced the end of production at the Tochigi plant, and the final car was a Premium edition T-spec for a customer in Japan.
Trim levels in the listings
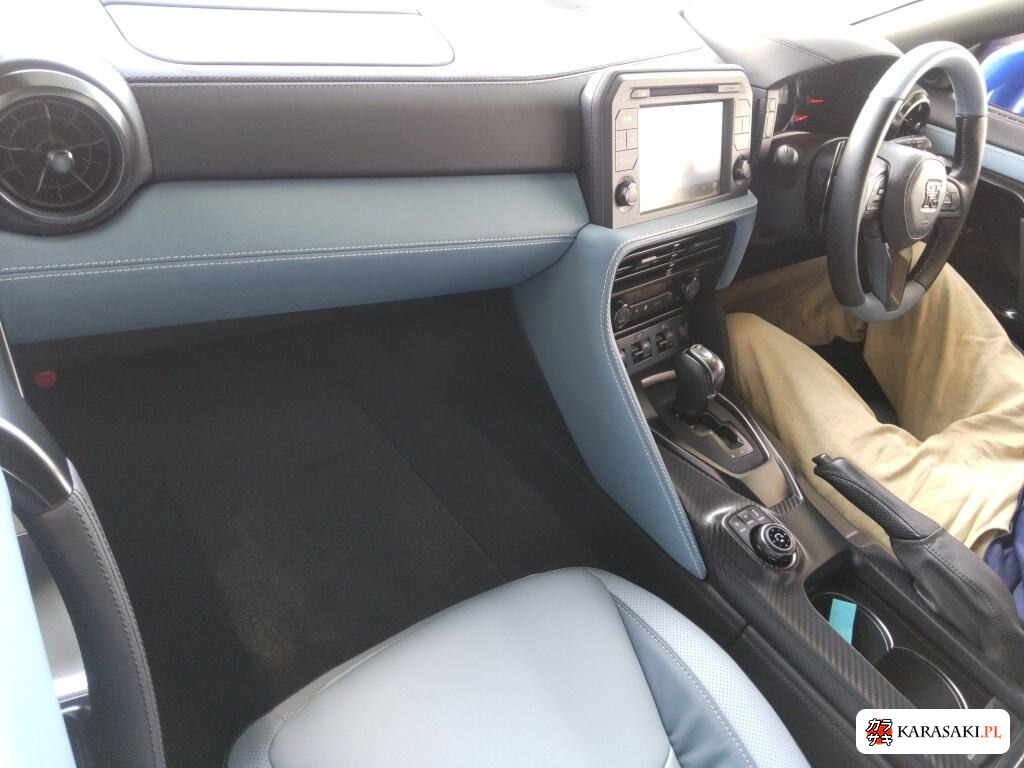
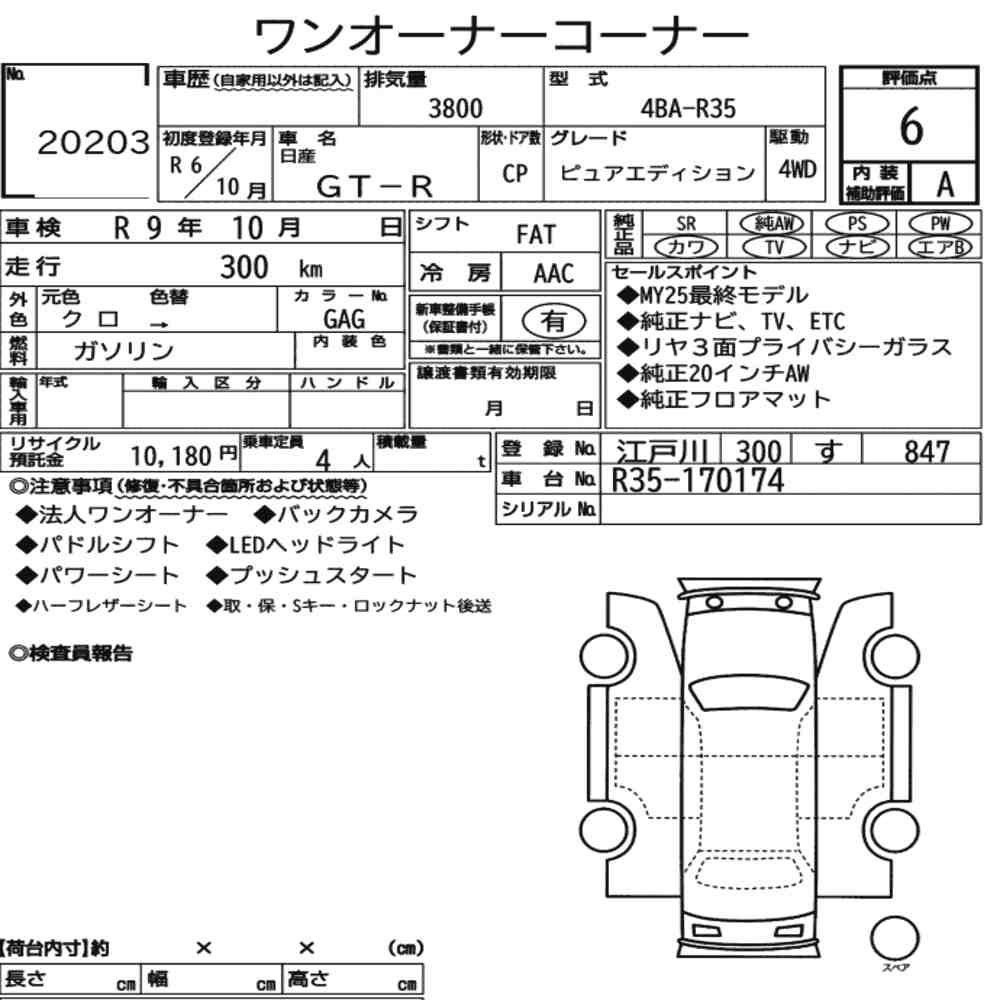
The most common are the Premium edition (154 listings) and the Black edition (94), followed by the Pure edition (45) and the Track edition engineered by Nismo (41). The Nismo, including the Special edition, accounts for 47 listings, the Premium edition T-spec for 15 and the Egoist for 9. The remaining 26 listings are the base grade, the Track edition T-spec, the SpecV, the Special edition and listings with no trim name. In total the 431 listings represent about 206 different cars, all of them right-hand drive.